Download
1 / 1
10 likes | 161 Vues
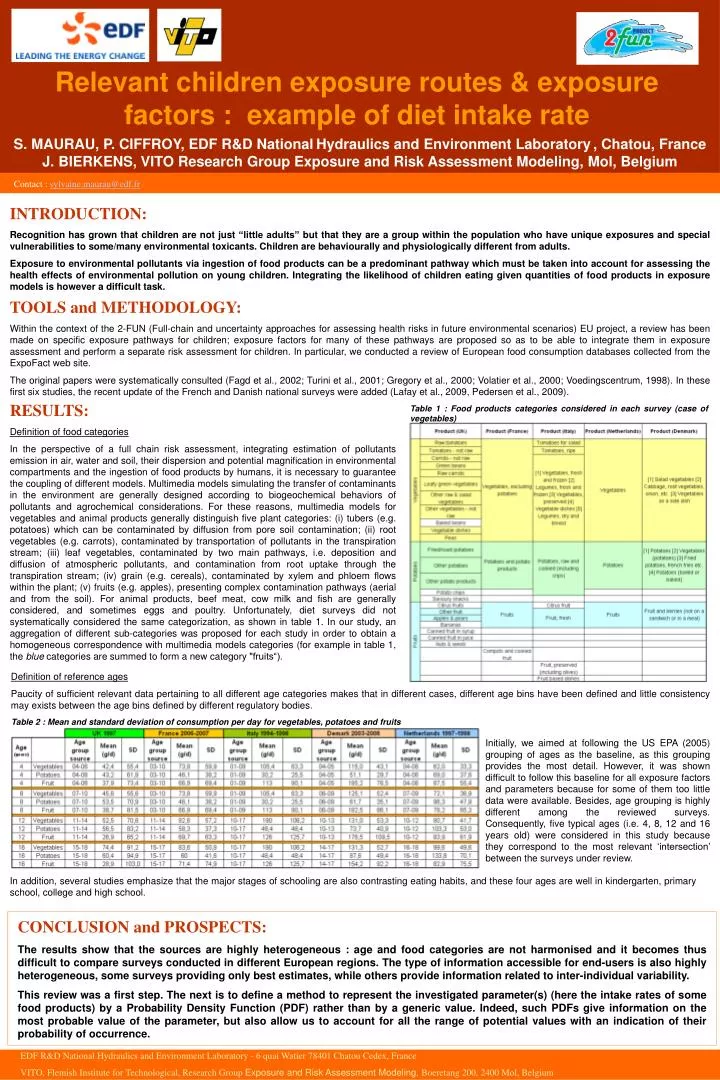
Relevant children exposure routes & exposure factors : example of diet intake rate. S. MAURAU, P. CIFFROY, EDF R&D National Hydraulics and Environment Laboratory , Chatou, France

E N D
Relevant children exposure routes & exposure factors : example of diet intake rate S. MAURAU, P. CIFFROY, EDF R&D NationalHydraulics and Environment Laboratory, Chatou, France J. BIERKENS, VITO Research Group Exposure and Risk Assessment Modeling, Mol, Belgium Contact : sylvaine.maurau@edf.fr INTRODUCTION: Recognition has grown that children are not just “little adults” but that they are a group within the population who have unique exposures and special vulnerabilities to some/many environmental toxicants. Children are behaviourally and physiologically different from adults. Exposure to environmental pollutants via ingestion of food products can be a predominant pathway which must be taken into account for assessing the health effects of environmental pollution on young children. Integrating the likelihood of children eating given quantities of food products in exposure models is however a difficult task. TOOLS and METHODOLOGY: Within the context of the 2-FUN (Full-chain and uncertainty approaches for assessing health risks in future environmental scenarios) EU project, a review has been made on specific exposure pathways for children; exposure factors for many of these pathways are proposed so as to be able to integrate them in exposure assessment and perform a separate risk assessment for children. In particular, we conducted a review of European food consumption databases collected from the ExpoFact web site. The original papers were systematically consulted (Fagd et al., 2002; Turini et al., 2001; Gregory et al., 2000; Volatier et al., 2000; Voedingscentrum, 1998). In these first six studies, the recent update of the French and Danish national surveys were added (Lafay et al., 2009, Pedersen et al., 2009). RESULTS: Definition of food categories In the perspective of a full chain risk assessment, integrating estimation of pollutants emission in air, water and soil, their dispersion and potential magnification in environmental compartments and the ingestion of food products by humans, it is necessary to guarantee the coupling of different models. Multimedia models simulating the transfer of contaminants in the environment are generally designed according to biogeochemical behaviors of pollutants and agrochemical considerations. For these reasons, multimedia models for vegetables and animal products generally distinguish five plant categories: (i) tubers (e.g. potatoes) which can be contaminated by diffusion from pore soil contamination; (ii) root vegetables (e.g. carrots), contaminated by transportation of pollutants in the transpiration stream; (iii) leaf vegetables, contaminated by two main pathways, i.e. deposition and diffusion of atmospheric pollutants, and contamination from root uptake through the transpiration stream; (iv) grain (e.g. cereals), contaminated by xylem and phloem flows within the plant; (v) fruits (e.g. apples), presenting complex contamination pathways (aerial and from the soil). For animal products, beef meat, cow milk and fish are generally considered, and sometimes eggs and poultry. Unfortunately, diet surveys did not systematically considered the same categorization, as shown in table 1. In our study, an aggregation of different sub-categories was proposed for each study in order to obtain a homogeneous correspondence with multimedia models categories (for example in table 1, the blue categories are summed to form a new category "fruits“). Table 1 : Food products categories considered in each survey (case of vegetables) Definition of reference ages Paucity of sufficient relevant data pertaining to all different age categories makes that in different cases, different age bins have been defined and little consistency may exists between the age bins defined by different regulatory bodies. Table 2 : Mean and standard deviation of consumption per day for vegetables, potatoes and fruits Initially, we aimed at following the US EPA (2005) grouping of ages as the baseline, as this grouping provides the most detail. However, it was shown difficult to follow this baseline for all exposure factors and parameters because for some of them too little data were available. Besides, age grouping is highly different among the reviewed surveys. Consequently, five typical ages (i.e. 4, 8, 12 and 16 years old) were considered in this study because they correspond to the most relevant ‘intersection’ between the surveys under review. In addition, several studies emphasize that the major stages of schooling are also contrasting eating habits, and these four ages are well in kindergarten, primary school, college and high school. CONCLUSION and PROSPECTS: The results show that the sources are highly heterogeneous : age and food categories are not harmonised and it becomes thus difficult to compare surveys conducted in different European regions. The type of information accessible for end-users is also highly heterogeneous, some surveys providing only best estimates, while others provide information related to inter-individual variability. This review was a first step. The next is to define a method to represent the investigated parameter(s) (here the intake rates of some food products) by a Probability Density Function (PDF) rather than by a generic value. Indeed, such PDFs give information on the most probable value of the parameter, but also allow us to account for all the range of potential values with an indication of their probability of occurrence. EDF R&D National Hydraulics and Environment Laboratory - 6 quai Watier 78401 Chatou Cedex, France VITO, Flemish Institute for Technological, Research Group Exposure and Risk Assessment Modeling, Boeretang 200, 2400 Mol, Belgium Coordonnées EDF R&D Coordonnées Pedon