Download
1 / 1
10 likes | 100 Vues
LONG-TERM VARIATION OF VERTICAL TURBULENT DIFFUSIVITY IN THE TROPOSPHERE AND LOWER STRATOSPHERE P. Bencze and S. Cseh Geodetic and Geophysical Research Institute, Hungarian Academy of Sciences H-9401 Sopron, P.O.B. 5, Hungary, E-mail: Bencze@ggki.hu. Introduction

E N D
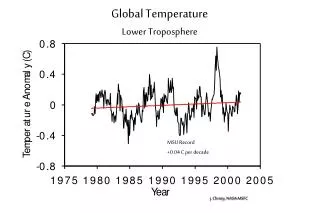
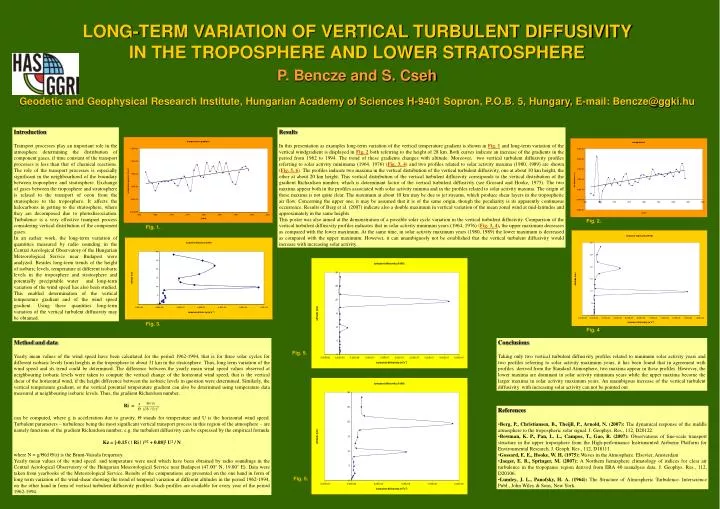
LONG-TERM VARIATION OF VERTICAL TURBULENT DIFFUSIVITY IN THE TROPOSPHERE AND LOWER STRATOSPHERE P. Bencze and S. Cseh Geodetic and Geophysical Research Institute, Hungarian Academy of Sciences H-9401 Sopron, P.O.B. 5, Hungary, E-mail: Bencze@ggki.hu Introduction Transport processes play an important role in the atmosphere determining the distribution of component gases, if time constant of the transport processes is less than that of chemical reactions. The role of the transport processes is especially significant in the neighbourhood of the boundary between troposphere and stratosphere. Exchange of gases between the troposphere and stratosphere is related to the transport of ozon from the stratosphere to the troposphere. It affects the halocarbons in getting to the stratosphere, where they are decomposed due to photodissociation. Turbulence is a very effective transport process considering vertical distribution of the component gases. In an earlier work, the long-term variation of quantities measured by radio sounding in the Central Aerological Observatory of the Hungarian Meteorological Service near Budapest were analyzed. Besides long-term trends of the height of isobaric levels, temperature at different isobaric levels in the troposphere and stratosphere and potentially precipitable water and long-term variation of the wind speed has also been studied. This enabled determination of the vertical temperature gradient and of the wind speed gradient. Using these quantities long-term variation of the vertical turbulent diffusivity may be obtained. Results In this presentation as examples long-term variation of the vertical temperature gradient is shown in Fig. 1 and long-term variation of the vertical windgradient is displayed in Fig. 2 both referring to the height of 28 km. Both curves indicate an increase of the gradients in the period from 1962 to 1994. The trend of these gradients changes with altitude. Moreover, two vertical turbulent diffusivity profiles referring to solar activity minimuma (1964, 1976) (Fig. 3, 4) and two profiles related to solar activity maxima (1980, 1989) are shown (Fig. 5, 6). The profiles indicate two maxima in the vertical distribution of the vertical turbulent diffusivity, one at about 10 km height, the other at about 20 km height. This vertical distribution of the vertical turbulent diffusivity corresponds to the vertical distribution of the gradient Richardson number, which is determinant factor of the vertical turbulent diffusivity (see Gossard and Hooke, 1975). The two maxima appear both in the profiles associated with solar activity minima and in the profiles related to solar activity maxima. The origin of these maxima is not quite clear. The maximum at about 10 km may be due to jet streams, which produce shear layers in the tropospheric air flow. Concerning the upper one, it may be assumed that it is of the same origin, though the peculiarity is its apparently continuous occurrence. Results of Berg et al. (2007) indicate also a double maximum in vertical variation of the mean zonal wind at mid-latitudes and approximately in the same heights. This poster was also aimed at the demonstration of a possible solar cycle variation in the vertical turbulent diffusivity. Comparison of the vertical turbulent diffusivity profiles indicates that in solar activity minimum years (1964, 1976) (Fig. 3, 4), the upper maximum decreases as compared with the lower maximum. At the same time, in solar activity maximum years (1980, 1989) the lower maximum is decreased as compared with the upper maximum. However, it can unambiguosly not be established that the vertical turbulent diffusivity would increase with increasing solar activity. Fig. 2. Fig. 1. Fig. 3. Fig. 4. Method and data Yearly mean values of the wind speed have been calculated for the period 1962-1994, that is for three solar cycles for different isobaric levels from heights in the troposphere to about 31 km in the stratosphere. Thus, long term variation of the wind speed and its trend could be determined. The difference between the yearly mean wind speed values observed at neighbouring isobaric levels were taken to compute the vertical change of the horizontal wind speed; that is the vertical shear of the horizontal wind, if the height difference between the isobaric levels in question were determined. Similarly, the vertical temperature gradient, or the vertical potential temperature gradient can also be determined using temperature data measured at neighbouring isobaric levels. Thus, the gradient Richardson number. Ri = can be computed, where g is acceleration due to gravity, Θ stands for temperature and U is the horizontal wind speed. Turbulent parameters – turbulence being the most significant vertical transport process in this region of the atmosphere – are namely functions of the gradient Richardson number, e.g. the turbulent diffusivity can be expressed by the empirical formula Kz = [-0.15 ( | Ri | )1/2 + 0.08]2 U2 / N where N = g/Θ(d Θ/z) is the Brunt-Vaisala frequency. Yearly mean values of the wind speed and temperature were used which have been obtained by radio soundings in the Central Aerological Observatory of the Hungarian Meteorological Service near Budapest (47.00° N, 19.00° E). Data were taken from yearbooks of the Meteorological Service. Results of the computations are presented on the one hand in form of long term variation of the wind-shear showing the trend of temporal variation at different altitudes in the period 1962-1994, on the other hand in form of vertical turbulent diffusivity profiles. Such profiles are available for every year of the period 1962-1994. Conclusions Taking only two vertical turbulent diffusivity profiles related to minimum solar activity years and two profiles referring to solar activity maximum years, it has been found that in agreement with profiles derived from the Standard Atmosphere, two maxima appear in these profiles. However, the lower maxima are dominant in solar activity minimum years while the upper maxima become the larger maxima in solar activity maximum years. An unambigous increase of the vertical turbulent diffusivity with increasing solar activity can not be pointed out. Fig. 5. • References • Berg, P., Christiansen, B., Theijll, P., Arnold, N. (2007): The dynamical response of the middle atmosphere to the tropospheric solar signal. J. Geophys. Res., 112, D20122. • Bowman, K. P., Pan, L. L., Campos, T., Gao, R. (2007): Observations of fine-scale transport structure in the upper troposphere from the High-performance Instrumented Airborne Platform for Environmental Research, J. Geoph. Res., 112, D18111. • Gossard, E. E., Hooke, W. H. (1975): Waves in the Atmosphere. Elsevier, Amsterdam • Jaeger, E. B., Springer, M. (2007): A Northern hemisphere climatology of indices for clear air turbulence in the tropopause region derived from ERA 40 reanalysis data. J. Geophys. Res., 112, D20106. • Lumley, J. L., Panofsky, H. A. (1964): The Structure of Atmospheric Turbulence. Interscience Publ., John Wiley & Sons, New York. Fig. 6.