Download
1 / 100
1k likes | 1.17k Vues
Chapter 7 Estimates and Sample Sizes. 7-1 Review and Preview 7-2 Estimating a Population Proportion 7-3 Estimating a Population Mean: Known 7-4 Estimating a Population Mean: Not Known 7-5 Estimating a Population Variance. 7.2. Estimating a Population Proportion. Definition.

E N D
Chapter 7Estimates and Sample Sizes 7-1 Review and Preview 7-2 Estimating a Population Proportion 7-3 Estimating a Population Mean: Known 7-4 Estimating a Population Mean: Not Known 7-5 Estimating a Population Variance
7.2 Estimating a Population Proportion
Definition A point estimate is a single value (or point) used to approximate a population parameter.
The sample proportion is the best point estimate of the population proportion . Definition
We conclude that the best point estimate of is 0.70. When using the sample results to estimate the percentage of all adults in the United States who believe in global warming, the best estimate is 70%. Example: In Research Center poll, 70% of 1501 randomly selected adults in the United States believe in global warming, so the sample proportion is = 0.70. Find the best point estimate of the proportion of all adults in the United States who believe in global warming.
Definition A confidence interval (or interval estimate) is a range (or an interval) of values used to estimate the true value of a population parameter. A confidence interval is sometimes abbreviated as CI.
A confidence level is the probability (often expressed as the equivalent percentage value) that the confidence interval actually does contain the population parameter, assuming that the estimation process is repeated a large number of times. (The confidence level is also called degree of confidence, or the confidence coefficient.) Definition Most common choices are 90%, 95%, or 99%.
95% CI for population proportion: “We are 95% confident that the interval from 0.677 to 0.723 actually does contain the true value of the population proportion .” This means that if we were to select many different samples of size 1501 and construct the corresponding confidence intervals, 95% of them would actually contain the value of the population proportion . The level of 95% refers to the success rate of the process being used to estimate the proportion.) Interpreting a Confidence Interval
Critical Values A standard z score can be used to distinguish between sample statistics that are likely to occur and those that are unlikely to occur. Such a z score is called a critical value. Critical values are based on the following observations: 1. Under certain conditions, the sampling distribution of sample proportions can be approximated by a normal distribution.
Critical Values 2. A z score associated with a sample proportion has a probability of of falling in the right tail.
Critical Values 3. The z score separating the right-tail region is commonly denoted by and is referred to as a critical value because it is on the borderline separating z scores from sample proportions that are likely to occur from those that are unlikely to occur.
Definition A critical value is the number on the borderline separating sample statistics that are likely to occur from those that are unlikely to occur. The number is a critical value that is a z score with the property that it separates an area of in the right tail of the standard normal distribution.
Notation for Critical Value The critical valueis the positivezvalue that is atthe vertical boundary separating an area ofin the right tail of the standard normal distribution.(The value ofis at the vertical boundary for thearea ofin the left tail.) The subscriptissimply a reminder that thezscore separates an areaof in the right tail of the standard normal distribution.
Finding for a 95% Confidence Level Critical Values
Finding for a 95% Confidence Level - cont Use a Z-Table find a z score of 1.96
Definition When data from a simple random sample are used to estimate a population proportion , the margin of error, denoted by , is the maximum likely difference (with probability , such as 0.95) between the observed proportion and the true value of the population proportion . The margin of error is also called the maximum error of the estimate and can be found by multiplying the critical value and the standard deviation of the sample proportions:
Confidence Interval for Estimating a Population Proportion = population proportion = sample proportion = number of sample values = margin of error = z score separating an area of in the right tail of the standard normal distribution
Confidence Interval for Estimating a Population Proportion 1. The sample is a simple random sample. 2. The conditions for the binomial distribution are satisfied: there is a fixed number of trials, the trials are independent, there are two categories of outcomes, and the probabilities remain constant for each trial. 3. There are at least 5 successes and 5 failures.
Confidence Interval for Estimating a Population Proportion where
Round-Off Rule for Confidence Interval Estimates of Round the confidence interval limits for to three significant digits.
1. Verify that the required assumptions are satisfied. (The sample is a simple random sample, the conditions for the binomial distribution are satisfied, and the normal distribution can be used to approximate the distribution of sample proportions because , and are both satisfied.) 2. Refer to Z-Table and find the critical value that corresponds to the desired confidence level. 3. Evaluate the margin of error Procedure for Constructing a Confidence Interval for
4. Using the value of the calculated margin of error, and the value of the sample proportion, , find the values of and . Substitute those values in the general format for the confidence interval: Procedure for Constructing a Confidence Interval for - cont 5. Round the resulting confidence interval limits to three significant digits.
Example: a. Find the margin of error that corresponds to a 95% confidence level. b. Find the 95% confidence interval estimate of the population proportion . c. Based on the results, can we safely conclude that the majority of adults believe in global warming? d. Assuming that you are a newspaper reporter, write a brief statement that accurately describes the results and includes all of the relevant information. In theChapter Problem we noted that a Pew Research Center poll of 1501 randomly selected U.S. adults showed that 70% of the respondents believe in global warming.The sample results are n = 1501, and
Requirement check: simple random sample; fixed number of trials, 1501; trials are independent; two categories of outcomes (believes or does not); probability remains constant. Note: number of successes and failures are both at least 5. Example: a)Use the formula to find the margin of error.
b)The 95% confidence interval: Example:
c) Based on the confidence interval obtained in part (b), it does appear that the proportion of adults who believe in global warming is greater than 0.5 (or 50%), so we can safely conclude that the majority of adults believe in global warming. Because the limits of 0.677 and 0.723 are likely to contain the true population proportion, it appears that the population proportion is a value greater than 0.5. Example:
d) Here is one statement that summarizes the results: 70% of United States adults believe that the earth is getting warmer. That percentage is based on a Pew Research Center poll of 1501 randomly selected adults in the United States. In theory, in 95% of such polls, the percentage should differ by no more than 2.3 percentage points in either direction from the percentage that would be found by interviewing all adults in the United States. Example:
Analyzing Polls When analyzing polls consider: 1. The sample should be a simple random sample, not an inappropriate sample (such as a voluntary response sample). 2. The confidence level should be provided. (It is often 95%, but media reports often neglect to identify it.) 3. The sample size should be provided. (It is usually provided by the media, but not always.) 4. Except for relatively rare cases, the quality of the poll results depends on the sampling method and the size of the sample, but the size of the population is usually not a factor.
Caution Never follow the common misconception that poll results are unreliable if the sample size is a small percentage of the population size. The population size is usually not a factor in determining the reliability of a poll.
Sample Size Suppose we want to collect sample data in order to estimate some population proportion. The question is how many sample items must be obtained?
Determining Sample Size (solve for n by algebra)
Sample Size for Estimating Proportion When an estimate of is known: When no estimate of is known:
Round-Off Rule for Determining Sample Size If the computed sample size n is not a whole number, round the value of n up to the next larger whole number.
Example: The Internet is affecting us all in many different ways, so there are many reasons for estimating the proportion of adults who use it. Assume that a manager for E-Bay wants to determine the current percentage of U.S. adults who now use the Internet. How many adults must be surveyed in order to be 95% confident that the sample percentage is in error by no more than three percentage points? a. In 2010, 73% of adults used the Internet. b. No known possible value of the proportion.
a) Use Example: To be 95% confident that our sample percentage is within three percentage points of the true percentage for all adults, we should obtain a simple random sample of 842 adults.
b) Use Example: To be 95% confident that our sample percentage is within three percentage points of the true percentage for all adults, we should obtain a simple random sample of 1068 adults.
Finding the Point Estimate and from a Confidence Interval Point estimate of : =(upper confidence limit) + (lower confidence limit) 2 Margin of Error: = (upper confidence limit) — (lower confidence limit) 2
Recap In this section we have discussed: Point estimates. Confidence intervals. Confidence levels. Critical values. Margin of error. Determining sample sizes.
7.3 Estimating a Population Mean Known
Key Concept 1. We should know that the sample mean is the best point estimate of the population mean . 2. We should learn how to use sample data to construct a confidence interval for estimating the value of a population mean, and we should know how to interpret such confidence intervals. 3. We should develop the ability to determine the sample size necessary to estimate a population mean.
Point Estimate of the Population Mean The sample mean is the best point estimate of the population mean .
Confidence Interval for Estimating a Population Mean (with Known) = population mean = population standard deviation = sample mean = number of sample values = margin of error = z score separating an area of in their right tail of the standard normal distribution
Confidence Interval for Estimating a Population Mean (with Known) 1. The sample is a simple random sample. (All samples of the same size have an equal chance of being selected.) 2. The value of the population standard deviation is known. 3. Either or both of these conditions is satisfied: The population is normally distributed or .
Confidence Interval for Estimating a Population Mean (with Known)
Definition The two values and are called confidence interval limits.
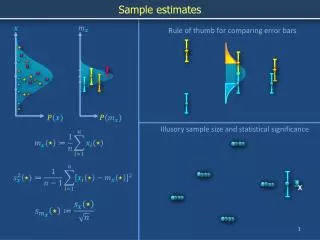
1. For all populations, the sample mean is an unbiased estimator of the population mean , meaning that the distribution of sample means tends to center about the value of the population mean . 2. For many populations, the distribution of samplemeanstends to be more consistent (with less variation) than the distributions of other sample statistics. Sample Mean
Procedure for Constructing a Confidence Interval for (with Known) 1. Verify that the requirements are satisfied. 2. Refer to Z- Table to find the critical value that corresponds to the desired confidence level. 3. Evaluate the margin of error 4. Find the values of Substitute those values in the general format of the confidence interval: 5. Round using the confidence intervals round-off rules.