Download
1 / 38
390 likes | 542 Vues
Anatomy of a population cycle: A c ase s tudy using Canada lynx. Dennis Murray Trent University. Collaborators. S. Abele (TNC) A . Borlestean (Trent U. ) J. Bowman (OMNR) S. Boutin (U. Alberta) K. Chan (Trent U.) R. Gau (NWTG) C. Krebs (UBC) M. O’Donoghue (YTG ).

E N D
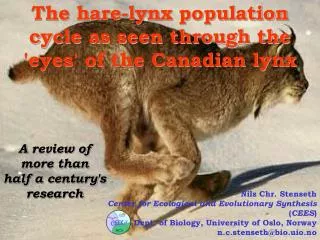
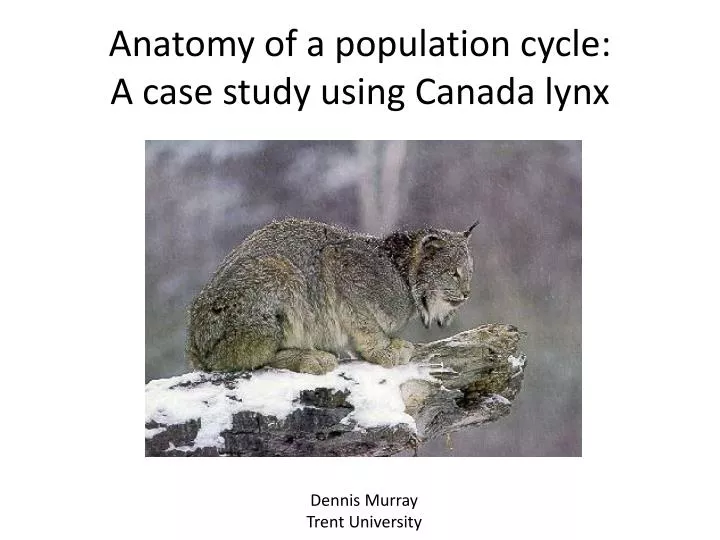
Anatomy of a population cycle: A case study using Canada lynx Dennis Murray Trent University
Collaborators • S. Abele (TNC) • A. Borlestean (Trent U.) • J. Bowman (OMNR) • S. Boutin (U. Alberta) • K. Chan (Trent U.) • R. Gau (NWTG) • C. Krebs (UBC) • M. O’Donoghue (YTG) • J. Roth (U. Manitoba) • J. Row (Trent U.) • T. Steury (Trent U.) • C. Szumski (U. Manitoba / Trent U.) • D. Thornton (Trent U.) • P. Wilson (Trent U.) • A. Wirsing (U. Washington)
More recent lynx harvest statistics Lynx numbers Harvest statistics continue to be collected and reveal high spatio-temporal variability. Differentiating between signal vs. noise remains challenging
Cyclic propensity in lynx harvest time series Murray et al (2008) • Most northern populations are cyclic, southern populations are less likely to cycle • All cyclic populations exhibit 9-10 year periodicity • Population variability is higher in the southern range
Cyclic propensity in hare harvest time series Murray et al (2008) • Northern snowshoe hare populations are cyclic • Cyclic populations exhibit 9-13 year periodicity • Southern hare populations have dampened fluctuations
Lynx and hare densities are closely associated Field studies reveal a close association between lynx and hare numbers Steury & Murray (2004)
Lynx and hare distributions are closely matched Snowshoe hare Canada lynx M. M. Wehtje(unpubl) Peers et al (2012)
Trophic interactions in the boreal forest Stenseth et al (1997)
Do alternate prey stabilize predator-prey population cycles? Hare Lynx
Lynx diet through a population cycle Biomass (%) Kills (%) O’Donoghue et al. (1998) • At increasing/high hare densities, lynx eat mainly hares • At low hare densities, almost 50% of lynx prey biomass is red squirrel
Lynx prey have distinct isotopic signatures Roth et al. (2007)
Lynx have distinct isotopic signatures across portions of their range N15 C13 C13 is higher in southwestern range, indicating a generalized diet Roth et al. (2007)
Lynx diet influences cyclic amplitude Lynx populations have a higher cyclic propensity when they rely heavily on snowshoe hares Roth et al. (2007)
Snowshoe hare in diet drives higher lynx recruitment P1-tailed = 0.04 R2 = 0.86 P1-tailed = 0.04 R2 = 0.86 Prop. juveniles in harvest Diet specialization C. Szumski (unpubl)
LV model including alternate prey dN1/dt = r1N1 (1 – N1 / k1) – Pf1 (N1) – δ1N1 (Hare) dN2/dt = r2N2 (1 – N2 / k2) – P f2 (N2) - δ2N2 (Squirrel) dP/dt = P (Χ1f1 (N1) + Χ2f2(N2) - δp)(Lynx) where, N : prey numbers (1 = hare; 2 = squirrel) P : lynx numbers r : rate of increase k : carrying capacity f : functional response δ: death rate Χ:conversion efficiency
Lynx-Hare functional response K. Chan (unpubl.)
Lynx-Squirrel functional response K. Chan (unpubl.)
Revised Lynx-Squirrel functional response K. Chan (unpubl.)
Correlation between squirrel numbers and mast crop Cones Squirrels S. Boutin (unpubl.) time lag = 1 year
Revised model dN1/dt = r1N1 (1 – N1 / k1) – Pf1 (N1) – δ1N1 (Hare) dN2/dt = r2N2 (1 – N2 / k2) – P f2 (N1) - δ2N2 + ε (Squirrel) dP/dt = P (Χ1f1 (N1) + Χ2f2(N1) - δp)(Lynx) • The revised model forces the lynx-squirrel functional response to reflect change in hare rather than change in squirrel densities. • Because squirrels are influenced by annual cone crop, stochasticity was included.
Rosenzweig-Macarthur model Prey Predator As the prey isocline shifts to the left, the system becomes increasingly unstable.
Increased instability when squirrels are included No Squirrel Squirrel Alternate prey consistently destabilize predator-prey cycles by moving the prey isocline to the left, not right Hares per 100 km2 K. Chan (unpubl.)
Simulations using case studies K. Chan (unpubl.)
Functional responses from case studies beaver moose Case studies also reveal increased instability with alternate prey K. Chan (unpubl.)
Increased numerical stability of lynx is driven by • Lowered capture efficiency of lynx on hare • - Maybe the case in southern populations • Increased lynx mortality rate • - Likely the case in southern populations • Increased in hare mortality rate • - Likely the case in southern populations • Reduced carrying capacity of hares • - Likely the case in southern populations
Evidence of density-dependent predation in southern hares A. Wirsing (unpubl)
Cycle attenuation in Fenoscandian voles Population cycles are becoming attenuated Statistical detection of cyclic attenuation is challenging given data quality Ims et al (2006)
Are lynx cycles attenuating? Lynx numbers Attenuation? • Robust statistical methods for detecting cyclic attenuation are lacking
Modeling cyclic attenuation in lynx • Climate change • Competition • Harvest regime M. Hornseth (unpubl)
The snowshoe hare is the keystone of the boreal forest ecosystem Krebs (2011)
Robust field data are essential for detecting attenuation Are snowshoe hare population Are hare cycles collapsing? Are hare populations becoming increasingly asynchronous? . . . . . . . . .
Model systems for understanding cyclic attenuation Model systems serve to develop a mechanistic understanding of density dependence and cyclic attenuation A. Borlestean (unpubl) A. Borlestean (unpubl)
Conclusion • Alternate prey destabilize predator-prey cycles • Southern lynx have lower cyclic propensity likely due to latitudinal changes in the lynx-hare relationship itself • Lynx population cycles may be attenuating due to factors like climate change, increased competition, and overharvest
Current needs & challenges in understanding population cycles • Good long-term empirical data (experimental and observational) • Clarity between statistical methods • Mechanistic & modeling studies • Methodology for detecting occurrence and underlying causes of cyclic attenuation