Download
1 / 19
190 likes | 348 Vues
Black sea OUTLOOK Conference, Odessa, 01-04 October , 2011. BLACK SEA PHYTOPLANKTON DATA QUALITY- PROBLEMS AND PROGRESS. Snejana Moncheva1, Maria Pantazi2, Larisa Pautova3, Laura Boichenko4, Dan Vassiliu4,Luydmila Mantzosh5 .

E N D
Black sea OUTLOOK Conference, Odessa, 01-04 October , 2011 BLACK SEA PHYTOPLANKTON DATA QUALITY- PROBLEMS AND PROGRESS Snejana Moncheva1, Maria Pantazi2, Larisa Pautova3, Laura Boichenko4, Dan Vassiliu4,Luydmila Mantzosh5 1Institute of Oceanology-BAS, Parvi Mai str., No 40, P.O.Box 152, Bulgaria 2HCMR P.O. BOX 712, Anavissos 19013, Greece 3P.P Shirshov IO-RAS, 36, Nahimovski prospect, Moscow, Russia, 117997 4NIMRD “GrigoreAntipa”, Mamaia bul., No 300, Constanta 3 , RO-900581 5IBSS,2 Nakhimov Ave. Sevastopol, 99011 Ukraine
The quality of biological data has gained a recognition as an essential part of international monitoring programmes, in response to the demand for strategic environmental evaluations such as the EU WFD, the MSFD etc. Informed decisions for environmental sound management can be made only on the basis of reliable data, and therefore certain level of data quality should be achieved to assure accuracy and precision of all measurement systems. The structural characteristics of phytoplankton communities bear valuable information about the evolution of microalgal communities and the trajectories of shifts under multiple environmental factors, including anthropogenic impacts. Details of phytoplankton analytical procedures are essential to compare data produced by different analysts either during a long-term monitoring programs in one area or between different areas in order to evaluate statistically significant long-term trends or spatial differences.
“Quality control of phytoplankton counting and biovolume estimates—an easy task or a Gordian knot?” E.Rott et all., 2007 OBJECTIVES I - present results from the intercalibrationexcercise • assess the degree of comparability/differences in phytoplankton and chlorophyll a data analysis among 4 Black sea laboratories • and where possible to make recommendations for further improvement and harmonization of research methodology in the Black Sea . II present actions taken towards solutions The expectation is that the results will assist regional assessments based on combined data sets
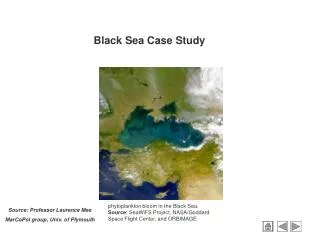
MATERIALS AND METHODS Samples from two stations (coastal and open sea) were collected and distributed for laboratory analysis in 3 replicates for each partner (SESAME intercalibation cruise-Apri’2009) • Phytoplankton attributes: • Phytoplankton Total abundance [cells/l] • Phytoplankton Total biomass (wet weight) – [mg/m3] • Phytoplankton common Taxonomic classes (Bacillariophyceae, Dinophyceae, Prymnesiophyceae, Cryptophyceae and Small flagellates ). • Chlorophyll a measurements Map of sampling stations Statistical analysis Robust statistical treatment (ANOVA test, Tukey test and a Lavene statistic) was applied in order to check the homogeneity of the variance between the groups. Stock plots were designed based on averages and standard deviationand the the Bray Curtis similarity index Common statistics employed during phytoplankton ring tests (average ±1 stdev and CV < 20 %). Participants IBSS-Sebastopol - UkR NIMRD – RO IO-BAS – BG IO-RAS - RU
Inventory of in-house lab methods Phytoplankton counts Chlorophyll a measurements
Phytoplankton abundance RESULTS Stock plot of the total phytoplankton abundance [cells/l - average and stdev] by partners Hierarchical clustering showed similarity between Bulgarian and Russian data > 85% while between Ukrainian - Bulgarian and Ukrainian - Russian was > 75% ) The statistical treatment of total abundance data show significant differences between the Ukrainian-Bulgarian resultsand between the Ukrainian - Russian results, while the difference between Bulgarian and Russian data were not significant Similarity cluster matrix of total phytoplankton abundance [cells/l - square root transformation] by labs
Phytoplankton abundance Average abundance [cells/l] stdev and CV [%] by partners Based on testing the reproducibility of the in-house analysis (replicates) and employing the CV < 20% assumption for the total numerical abundance the results reveal a good reproducibility of the in-house replicates and very close results between the different labs, with the exception of Ukraine, where the difference was between 25-30% The comparison of phytoplankton abundance results by taxonomic classes reveal compliance to the 20% CV only for Bacillariophyceae, while for the other classes the differences among the participating labs are substantial, especially critical for the small flagellates, where even the in-house results show inconsistencies for all partners
Phytoplankton biomass Stock plot of the total phytoplankton biomass [mg/m3 - average and stdev] by partners Similar to the total abundance the hierarchical clustering of total biomass showed similarity between Bulgarian and Russian data > 85% while between Ukrainian - Bulgarian and Ukrainian - Russian was > 75% )
Phytoplankton biomass Similar to the phytoplankton abundance at the level of taxonomic classes the differences among the participating labs are substantial, especially critical for Prymnesiophyceae and small flagellates, where even the in-house results show inconsistencies for all partners. Albeit the good agreement between the data among some of the labs this is not systematic for all the taxonomic groups
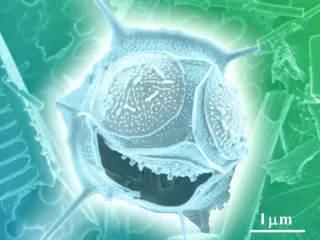
For the common species biovolume comparative analysis reveal the differences are substantial, for the most abundant species such as Pseudo-nitzschiadelicatissima and Emilianiahuxley the biovolume varies more than twice (202-409 mkm3 and 145- 268 mkm3 respectively ) for some species the differences exceeding 3 fold As expected the analyzed sub-sample volume is important for the species diversity (no of species) recorded in the samples
Chlorophyll a [mg/m3] The results of chlorophyll a measurements reveal good in-house reproducibility for BG and RO and higher than 10% difference for RU lab - Table 18. The difference between the BG and RO data is within the (range average ±s 1stdev)
CONCLUSSIONS and RECCOMENDATIONS • For the total phytoplankton abundance the results between Bulgaria, Russia and Romania are comparable (insignificant differences) while the difference with Ukrainian lab is between 25-30% • For the total phytoplankton biomass there is a good agreement between Romania and Ukraine, about 20% (acceptable) difference between Bulgaria and all other labs and a 30% difference between Russia, Romania and Ukraine. • Both for the phytoplankton abundance and biomass at the level of taxonomic classes the differences are substantial especially for Prymnesiophyceae and Small flagellates. If taxonomic classes data would be used as one data set they should be treated with caution. • The difference of chl. a results between BG and RO is about 10% and the data sets could be comparable. The BG and RO measurements are between 1.3-1.5 higher than the RUS results. The results give ground for the following recommendations: A phytoplankton check-list with unified geometric shapes for the different species is essential to avoid differences in the species biovolume estimation that reflect the final biomass results Analysis of at least 1 ml counting chamber is highly recommended to better detect species diversity In order to avoid taxonomic miss-match WoRMS taxonomy is mandatory
Phytoplankton Workshop, Istanbul 21-23 June 2010 UP-GRADE BS SCENE PROJECT + BLACK SEA COMMISSION Phytoplankton expert group
CHECK LIST OF BLACK SEA PHYTOPLANKTON, REFERENCE BIOVOLUMES and DATA BASE Software (OleksandraSergeyeva, KseniiaSkuratova IBSS, Sebastopol, Ukraine) The special software for creation of online marine species checklists was developed. This software is based on wiki engine and has special developed functions which make it easy to add, delete, move species and add any type of structured information in the form of patterns, which can be easily added by the checklist administrator on request of users. Each species has the corresponding page, where all information is placed either in form of predefined patterns or in the form of text, images, tables etc. on-line: http://phyto.bss.ibss.org.ua Biovolume, shapes etc.(Bryantsteva Y., IBSS, Sebastopol, Ukraine) Efforts have been made to create one reference list of biovolumes for Black Sea microalgae. Thus for each species in the checklist the appropriate suggested figure to calculate biovolume was attached. For detailed research of morphometric characteristics of the community the more precise figure is also suggested where possible. on-line: http://phyto.bss.ibss.org.ua
UPGRADE BLACK SEA SCENE GA 226592, FP7, EC GUIDELINES FOR QUALITY CONTROL OF BIOLOGICAL DATA- PHYTOPLANKTON SnejanaMoncheva November 2010
Conduct ring tests Maintain the BS Commission web site operational !!!! Apply the QC/QA guidelines to real data sets Finalise the data-base format Phytoplankton expert group THE WAY FORWARD Finalise the automated system Finalise the check-list
Participants in theSESAMEintercalibration cruise THANK YOU FOR THE ATTENTION