Download
1 / 9
90 likes | 155 Vues
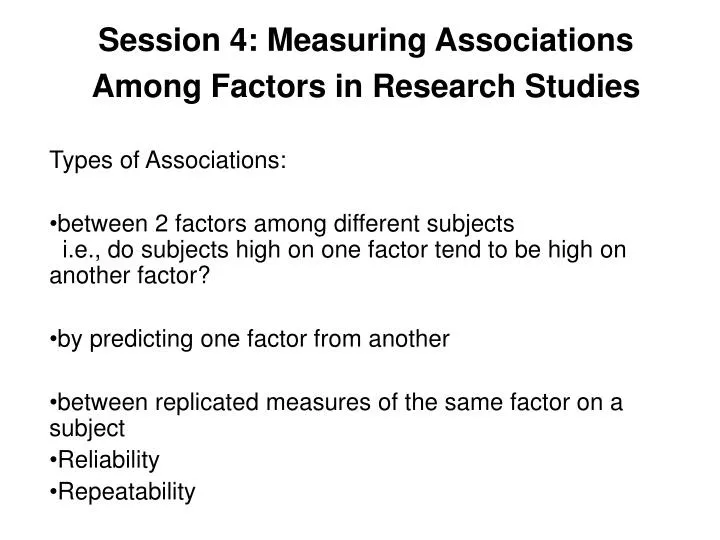
Session 4: Measuring Associations Among Factors in Research Studies. Types of Associations: between 2 factors among different subjects i.e., do subjects high on one factor tend to be high on another factor? by predicting one factor from another

E N D
Session 4: Measuring Associations Among Factors in Research Studies Types of Associations: between 2 factors among different subjects i.e., do subjects high on one factor tend to be high on another factor? by predicting one factor from another between replicated measures of the same factor on a subject Reliability Repeatability
Correlation • Pearson correlation, r, used when X and Y are different measures • Ranges from -1 (perfect inverse association) to 1 (direct association) • Value of r does not change: • if scales (units) of X and Y are changed • if roles of X and Y are interchanged • Value of r does change: • if the range of X or Y is restricted • if X is fixed and Y is measured (depends on values chosen for X) • i.e., subsets of possible X,Y are selected • p-value for r measures whether r is sig'ly different from 0; small p indicates X-Y association
Regression Regression: • fits a straight line to the scatterplot of X and Y • measures association between X and Y, and • quantifies predicting Y from X
Regression, continued • Association: • using r or slope of fitted line are equivalent for assessing whether X and Y are related • significance (p-value) for r and slope are the same • Prediction: • slope = r*(sy/sx) specifies expected ΔY for 1-unit change in X • software gives the fitted line, r (as 100*r2), and: • 95% CI for slope [ for data above: ~2.16 ±2SE(slope) = 2.16 ± 0.22 = 1.94 to 2.38 = within red dashed lines] • 95% CIs for predictions [ within blue dashed lines vertically for a fixed X ]
Reliability • Only used with replicated data, i.e., same quantity measured multiple times on the same subject under identical conditions • With 2 replications, reliability = pearson correlation between the 2 replicates • Dependent on the range of values, i.e., often different for different types of subjects • Dependent on the ordering of the replicates (i.e., change order for half of the subjects, and r can change) • Intraclass correlation, rI, is a more general measure of reliability: • rI is the average r, among all replicate interchanges within subjects • is usually close to r, if the two sets of conditions for the two reps were really equivalent • from an ANOVA table (Session 5), it is calculated as rI = [MSa - MSw]/[MSa + (#reps-1)MSw]
Measurement Error • Estimate of measurement error is denoted by sw, and is calculated by finding replicate variability within many subjects and averaging over subjects • ANOVA Table (session 5) gives sw. With 2 replications, sw = sqrt([ΣΔi2]/2n), summed over n subjects • measures how close a single value for an individual is expected to be to his "true" (mean) value • With 95% certainty, a single measurement is within about ±2sw of the true value
Repeatability • Measures how close together a pair of values for an individual are expected to be • Is ±1.96*Sqrt(2)*sw = 2.77sw • With 95% certainty, two values are within about ±2.77sw
Example of Repeatability See next slide for graph: • Two pain assessments (from 0 to 100) were made 1 minute apart in each subject • Intraclass correlation r = 0.97 • Repeatability = ±2.77sw is about ±18 • Note that ±18 is large for a range of 100, even though correlation is almost 1.
Repeatability ofVisual Analog Pain Scale Reference: Bijur PE, Silver W, Gallagher EG. Reliability of the Visual Analog Scale for Measurement of Acute Pain, Acad Emerg Med, 2001;8:1153-1157.