Download
1 / 10
100 likes | 218 Vues
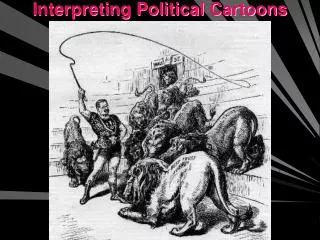
Interpreting a political cartoon, p. 654. 7-1. Whom does the person in the cartoon represent? 7-2. What is the person doing?. Interpreting a circle graph, p. 655. 7-3. What information does this circle graph present? 7-4. Which ethnic group includes the largest percentage of Americans?.

E N D
Interpreting a political cartoon, p. 654 7-1. Whom does the person in the cartoon represent? 7-2. What is the person doing?
Interpreting a circle graph, p. 655 7-3. What information does this circle graph present? 7-4. Which ethnic group includes the largest percentage of Americans?
Interpreting a circle graph, p. 655 7-5. Which groups represent less than 1% of the people in the U.S.? 7-6. What percentage of the U.S. population is represented by African Americans?
Interpreting a circle graph, p. 655 7-7. The smallest ethnic group has lived in the U.S. the longest. What is this group? 7-8. Which group’s population is about 3 times greater than the Asian population?
Drawing inferences and conclusions, p. 656 7-9. What is the subject of the line graph? 7-10. What information is shown on the horizontal axis?
Drawing inferences and conclusions, p. 656 8-1. What was the country that provided the most immigrants in the U.S. between 1820 and 1860? 8-2. What information is shown on the vertical axis?
Comparing data, p.657 8-3. Which U.S. city had the greatest population in 1790? 8-4. in 2000?
Comparing data, p.657 8-5. What was the population of Philadelphia in 1790? 8-6. in 2000?
Comparing data, p.657 8-7. Which city had the third largest population in 1790? 8-8. Which cities are on both lists?
Categorizing & Analyzing Information, p. 658 8-9. Under which economic system does the government have the most control? 8-10. Under which system would people be the most likely to have the same job as their parents?