Download
1 / 33
330 likes | 528 Vues
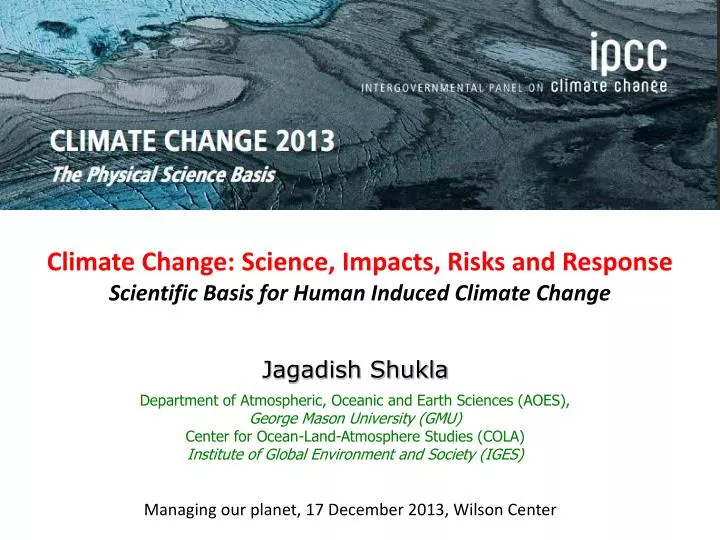
Climate Change: Science, Impacts, Risks and Response Scientific Basis for Human Induced Climate Change. Jagadish Shukla Department of Atmospheric, Oceanic and Earth Sciences (AOES), George Mason University (GMU) Center for Ocean-Land-Atmosphere Studies (COLA)

E N D
Climate Change: Science, Impacts, Risks and ResponseScientific Basis for Human Induced Climate Change Jagadish Shukla Department of Atmospheric, Oceanic and Earth Sciences (AOES), George Mason University (GMU) Center for Ocean-Land-Atmosphere Studies (COLA) Institute of Global Environment and Society (IGES) Managing our planet, 17 December 2013, Wilson Center
Greenhouse Effect:Without it, the Earth would be uninhabitable. Mean Climate: Incoming Energy = Outgoing Energy
MARS 1.56 AU from Sun F = 592 W/m2 Albedo = 17% CO2 = ~0% Tsfc = 210 K A Tale of Three Planets EARTH 1.00 AU from Sun F = 1367 W/m2 Albedo = 30% CO2 = ~0.03% Tsfc = 288 K VENUS 0.72 AU from Sun F = 2639 W/m2 Albedo = 78% CO2 = ~96% Tsfc = 737 K Mars: −63oC Earth: 15oC (59oF) Surface Temperature Venus: 464oC
Outline • The observed climate change during the past 50-100 years • The causes of hiatus in global warming during the past 15 years • Projections of future global warming
Global Warming Global Warming is the increase in the average temperature of the Earth’s near surface air and oceans since the mid-20th century and its projected continuation. (Wikipedia) Global Land-Ocean Temperature (1880-2011) Annual Mean 5-year Mean Relative to the 1951-1980 mean (GISS, New York)
Greenland Ice Mass • The blue error bars include only the contributions from uncertainties in the GRACE gravity fields. Velicogna and Wahr (2006)
Arctic Sea Ice is Disappearing Sea Ice Extent Aug 1982 Sea Ice Extent Aug 2012
Annual Cycle of NH Sea Ice Area 2012 2013 http://arctic.atmos.uiuc.edu/cryosphere/
An Elegant Science Question: Are increases in greenhouse gases responsible for increase in global mean temperature (global warming)? 14.6 Global Temperature & Carbon Dioxide 1860-2008 395 0.76°C (1.4°F) since 1900 14.4 365 0.55°C (1.0°F) since 1979 14.2 335 14.0 13.8 305 13.6 275 13.4 2012 ~ 400 ppm
Are Humans Responsible for Climate Change? • Are GHG increasing? - Yes • Is global mean temperature increasing? - Yes • Does increase in GHG cause global warming? - Yes • Are increases in GHG due to human activities? – Yes • Yes to all four questions suggests (but does not prove) that human activities could be responsible for global warming. • IPCC:Assess and evaluate projections of future climate change by complex climate models developed by scientist worldwide to determine is the observed global warming is due to observed changes in GHG?
Intergovernmental Panel on Climate Change (IPCC) IPCC has been established by WMO and UNEP to assess scientific, technical and socio- economic information relevant for the understanding of climate change, its potential impacts and options for adaptation and mitigation. Working Group I: The Physical Science Basis Working Group II:Impacts, Adaptation and Vulnerability Working Group III:Mitigation of Climate Change 2013: Twentyclimate modeling groups from 13 countries: Australia, China(3), Canada, USA(4), Italy,France(2), Europe, UK, Korea, Russia, Japan(2), Germany, Norway submitted results from39 climate models.
What is a Climate Model? Equations of motions and laws of thermodynamics to predict rate of change of: T, P, V, q, etc. (A, O, L, CO2, etc.) Climate Dynamics • 10 Million Equations: • 100,000 Points × 100 Levels × 10 Variables • With Time Steps of:~ 10 Minutes • Use Supercomputers
(Net) Global Warming • Warming • 1. Increasing GHG (CO2, CH4, N2O) • CO2: Carbon Dioxide : Emission from fossil fuel • CH4: Methane : Agriculture (livestock) • N2O: Nitrous Oxide : Agriculture (soil management) • CFC • 2. Land use change • Cooling • Aerosols • Man made/Natural • Volcanoes • IPCC(2013): CO2 in ATM increase from 1750 – 2012: 40% • Rate of increase fastest in 22,000 years
Global mean, volume mean ocean temperature Courtesy of Tom Delworth (GFDL) GFDL Model Simulations
Center of Ocean-Land-Atmosphere studies Natural Forcing cannot explain observations Observations Predictions with Anthropogenic/Natural forcings Predictions with Natrual forcings 1.0º C IPCC 2007
Global Warming Hiatus? Global Land-Ocean Temperature (1880-2012) Relative to 1951-1980 mean (GISS, New York)
NOAA (1880 – 2012) NOAA (1960 – 2012)
Possible Explanation of Hiatus in Warming • Increase in Aerosols: Anthropogenic (China, India) ,and small volcanoes • Enhanced heat uptake by the oceans • More La Nina (cooling) events than El Nino (warming) events • Decreasein stratospheric water vapor • LowSun spot activity • Multi-decadal variability opposite to warming
Arctic Temperature Anomaly Global Temperature Anomaly
Outline • The role of human activities in the observed global warming during the past 50-100 years • The causes of hiatus in global warming during the past 15 years • Projections of future global warming
21st Century Trend (K/100yrs) for Global Mean 2m Temp (RCP8.5)
Annual mean precipitation change(2081 to 2100 mean ) minus (1986 to 2005 mean)
Change in Sea level (0.8 mm/year; 1.9 mm/year; 3.2 mm/year) 2000 - 2100 1700 - 2100
Letter from More than 200 members of the U.S. National Academy of Sciences • There is compelling, comprehensive, and consistent objective evidence that humans are changing the climate in ways that threaten our societies and ecosystems on which we depend. SCIENCE, 7 May 2010
IPCC AR5 Working Group I: Summary for Policy Makers Humans are Causing Climate Change Headlines, 30 September 2013 • Global surface temperature change for the end of the 21st century is likely to exceed 2°C for RCP6.0 and RCP8.5. • Note: • Eemian period: 114 - 130,000 years ago, ~ 2°C ; sea level 4 - 6 meters • Pliocene period: 2.6 - 5.3 million years ago, 3-4 °C ; sea level 15 - 20 meters
IPCC AR5 Working Group I: Summary for Policy Makers Humans are Causing Climate Change Headlines, 30 September 2013 • Human influence on the climate system is clear. This is evident from the increasing greenhouse gas concentrations in the atmosphere, positive radiative forcing, observed warming, and understanding of the climate system. • It is extremely likely (95%) that human influence has been the dominant cause of the observed warming since the mid-20th century.
THANK YOU! ANY QUESTIONS?