Download
1 / 15
150 likes | 331 Vues
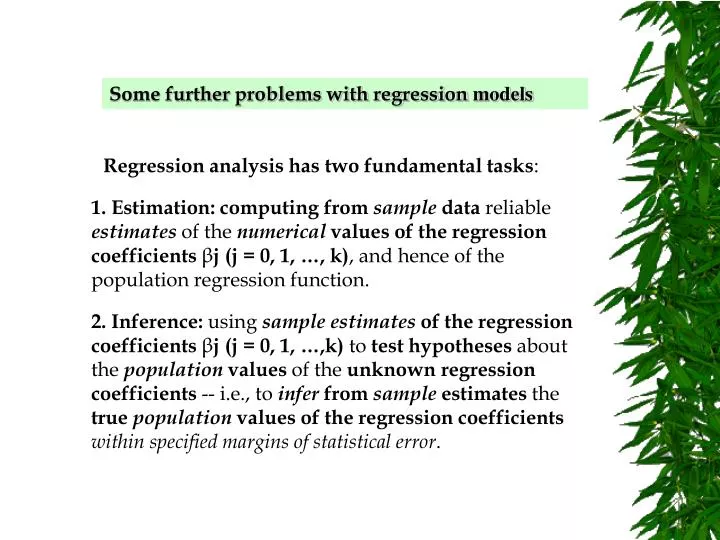
Some further problems with regression models. Regression analysis has two fundamental tasks :. 1. Estimation: computing from sample data reliable estimates of the numerical values of the regression coefficients β j (j = 0, 1, …, k) , and hence of the population regression function.

E N D
Some further problems with regression models Regression analysis has two fundamental tasks: 1. Estimation: computing from sample data reliable estimates of the numerical values of the regression coefficients βj (j = 0, 1, …, k), and hence of the population regression function. 2. Inference: using sample estimates of the regression coefficients βj (j = 0, 1, …,k) to test hypotheses about the population values of the unknown regression coefficients -- i.e., to infer from sample estimates the true population values of the regression coefficients within specified margins of statistical error.
CONFIDENCE INTERVALS FOR PARAMETERS Let the population regression model be Let b0, b1 , . . , bK be the least squares estimates of the population parameters and sb0, sb1, . . ., sbK be the estimated standard deviations of the least squares estimators (square roots from the diagonal items of variance-covariance matrix).
CONFIDENCE INTERVALS FOR PARAMETERS If the regression errors i , are normally distributed and the standard regression assumptions hold, the 100(1 - )% confidence intervals for the partial regression coefficients j, are given by and the random variable t(n – k - 1) follows a Student’s t distribution with (n – k - 1) degrees of freedom.
STANDARD ERROR FOR REGRESSION PARAMETERS Y-weekly salary ($) X1 –length of employment(months) X2-age (years) Se2
STANDARD ERROR FOR REGRESSION PARAMETERS variance-covariance matrix Estimating β0 based on similar samples we can make a mistake about57 units.
CONFIDENCE INTERVALS FOR PARAMETERS t-Student statistic for the level of significance 0,05 and df=13 is 2,160 Confidence interval for β0 Interval with the lower limit 338,3508 $ and the upper limit 585,3495$ covers the unknown value of parameter β0 (for population) with 95% probability.
CONFIDENCE INTERVALS FOR PARAMETERS t-Student statistic for the level of significance 0,05 and df=13 is 2,160 Confidence interval for β1 Interval with the lower limit 0,3526 $ and the upper limit 0,9898$ covers the unknown value of parameter β1(for population) with 95% probability.
CONFIDENCE INTERVALS FOR PARAMETERS t-Student statistic for the level of significance 0,05 and df=13 is 2,160 Confidence interval for β2 Interval with the lower limit –5,2124$ and the upper limit 2,4456$ covers the unknown value of parameter β21(for population) with 95% probability.
TESTING ALL THE PARAMETERS OF A MODEL Consider the multiple regression model To test the null hypothesis against the alternative hypothesis at a significance level we can use the decision rule where F , k, n–k–1 is the critical value of F the computed F k,n–k–1 follows an F distribution with numerator degrees of freedom k and denominator degrees of freedom (n–k–1)
TESTING ALL THE PARAMETERS OF A MODEL F-value computed from the sample F-value from F tables F , k, n–k–1= F0,05, 2, 13= 3,81 F comp >Fα,k,n-k-1 28,448>3,81 We reject the null hypothesis. At least one parameter is statistically significant.
TESTING PARAMETERS OF A MODEL INDIVIDUALLY If the regression errors are normally distributed and the standard least squares assumptions hold, the following tests have significance level . To test either null hypothesis against the two-sided alternative the decision rule is
Don’t reject the null hypothesis t α, n – k – 1 t α, n – k – 1 0 Reject H0 Reject H0 compare t comp. and t-Student and make a decision
TESTING PARAMETERS OF A MODEL INDIVIDUALLY Y-weekly salary ($) X1 –length of employment(months) X2-age (years) The null hypothesis can better be stated as: independent variable Xj does not contribute to the prediction of Y, given that other independent variables already have been included in the model The alternative hypothesis can better be stated as: independent variable Xj does contribute to the prediction of Y, given that other independent variables already have been included in the model
TESTING PARAMETERS OF A MODEL INDIVIDUALLY Y-weekly salary ($) X1 –length of employment(months) X2-age (years) The length of employment(X1) does not contribute to the prediction of weekly salary (Y), given that the age (X2) already has been included in the model. The length of employment(X1) does contribute to the prediction of weekly salary (Y), given that the age (X2) already has been included in the model. t-value computed from the sample t-value from t-Student tables is 2,16 We reject the null hypothesis.The length of employment(X1) does contribute to the prediction of weekly salary (Y), given that the age (X2) already have been included in the model.
TESTING PARAMETERS OF A MODEL INDIVIDUALLY Y-weekly salary ($) X1 –length of employment(months) X2-age (years) The age(X2) does not contribute to the prediction of weekly salary (Y), given that the length of employment (X1) already has been included in the model. The age(X2) does contribute to the prediction of weekly salary (Y), given that the length of employment (X1) already has been included in the model. t-value computed from the sample t-value from t-Student tables is 2,16 We don’t reject the null hypothesis.The age(X2)does not contribute to the prediction of weekly salary (Y), given that the length of employment (X1) already has been included in the model.