Download
1 / 7
70 likes | 310 Vues
DISTRIBUCION DE FRECUENCIAS AGRUPADAS. REMEDIOS GOMEZ RAMOS ANDREA SANCHEZ hernandez MARITZA RODRIGUEZ MERCADO. DISTRIBUCIÓN DE FRECUENCIAS AGRUPADAS. Se emplea si las variables toman un número grande de valores o si la variable es continúa.

E N D
DISTRIBUCION DE FRECUENCIAS AGRUPADAS REMEDIOS GOMEZ RAMOS ANDREA SANCHEZ hernandez MARITZA RODRIGUEZ MERCADO
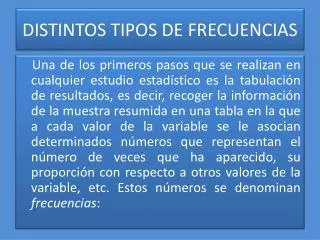
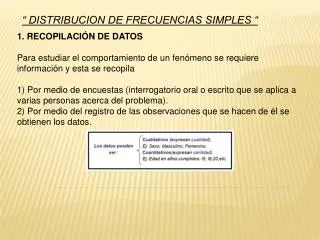
DISTRIBUCIÓN DE FRECUENCIAS AGRUPADAS Se emplea si las variables toman un número grande de valores o si la variable es continúa. Cada categoría o grupo en una distribución agrupada es conocido como intervalo de clase. Se agrupan los valores en intervalos que tengan la misma amplitud denominadas “ CLASES”. A cada clase se le asigna su frecuencia correspondiente.
“ LIMITES DE LA CLASE” Cada clase esta delimitada por el limite inferior de la clase y el limite superior. Ejemplo: Dado el intervalo 90-94 Límite superior: 94.5 Límite inferior: 89.5 Para ubicar cualquier valor decimal en el intervalo correcto hay que redondear al número par más cercano.
LA AMPLITUD DE LA CLASE Es la diferencia entre el limite inferior y el limite superior de la clase Ejemplo: Límite 90-94 Amplitud de clase 94-90= 4
PUNTO MEDIO Es el puntaje medio en le intervalo de clase. Puede ser calculado a partir de los puntajes más altos a más bajos en cualquier intervalo. Ejmplo: Intervalo: 90-94 Punto medio (90 + 94)/2 = 92
EJEMPLO DE DISTRIBUCION DE FRECUENCIAS AGRUPADAS Se localizan los valores menor y mayor de la distribución
98-50= 48 DATOSDIVIDIMOS ENTRE EL NÚMERO DE INTERVALOS QUE NECESITEMOS (5 A 20)48/7= 6.8 CONSTRUIMOS NUESTROS INTERVALOS