Download
1 / 51
520 likes | 706 Vues
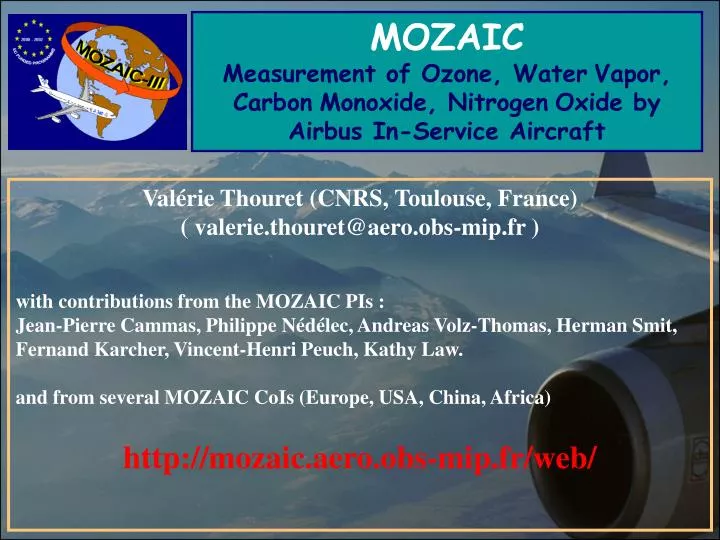
MOZAIC Measurement of Ozone, Water Vapor, Carbon Monoxide, Nitrogen Oxide by Airbus In-Service Aircraft. Valérie Thouret (CNRS, Toulouse, France) ( valerie.thouret@aero.obs-mip.fr ) with contributions from the MOZAIC PIs :

E N D
MOZAIC Measurement of Ozone, WaterVapor, CarbonMonoxide, NitrogenOxide by Airbus In-Service Aircraft Valérie Thouret (CNRS, Toulouse, France) ( valerie.thouret@aero.obs-mip.fr ) with contributions from the MOZAIC PIs : Jean-Pierre Cammas, Philippe Nédélec, Andreas Volz-Thomas, Herman Smit, Fernand Karcher, Vincent-Henri Peuch, Kathy Law. and from several MOZAIC CoIs (Europe, USA, China, Africa) http://mozaic.aero.obs-mip.fr/web/
MOZAIC – INSTRUMENTATION (on commercial aircraft) PITOT TUBES ON THE AIRCRAFT FUSELAGE INSTRUMENTATION BELOW THE COCKPIT O3/CO/H2O/NOy/DAS
MOZAIC Consortium Forschunszentrum Jülich ☺The transport is free of charge !!
MOZAIC Measurement of Ozone, WaterVapor, CarbonMonoxide, NitrogenOxide by Airbus In-Service Aircraft • Why ? Comprehensive and continuous observations are needed to contribute to the assessment of climate change and of the impact of aircraft • Ozone and water vapor in UT/LS have a key role in climate • Large natural variability in space and time • The general aim of MOZAIC is to collect data for studies on: • Atmospheric transport and chemical processes • Budgets of ozone and water vapor in the UT/LS (and CO and NOy) • Inter-annual variability and long term tendencies of the atmospheric composition • Validation of global chemistry-transport models and regional air quality models • Validation of new satellite observations • Assessment of aircraft impact on the atmosphere Passenger aircraft are a very powerful observing platform: daily flights
MOZAIC I, II & III (1994-2006) as EU project MOZAIC Aug. 1994 – June. 2009 1 record every 4s High resolution vertical profiles during take-off and landing (~ 20m) High resolution horizontal profiles at 9-12 km altitude during inter-continental flight (~ 1 km) Regularity of measurements with 5 aircraft flying almost every day 10% 3% 9% 32 000 Flights 230 000 Hours • 1994-2002: ≈ 20 000 flights with O3/H2O • 2002-2009: ≈ 12 000 flights with additional CO (4 aircraft) and with additional CO/NOy (1 aircraft)
Status of MOZAIC From 5 to 3 aircraft : • MOZAIC fleet in October 2009: • Lufthansa 2 aircraft (one with the NOy instrument) • Air Namibia 1 aircraft since 2006 (transport & maintenance costs: CNRS and FZJ) : will probably stop at the end of the year … • Air France MOZAIC instrumentation dropped off in 2004 • Austrian MOZAIC instrumentation dropped off in 2006 • MOZAIC database: • Data base opened to co-investigators under a data protocol • On-line request to access the data: http://mozaic.aero.obs-mip.fr/web/
MOZAIC • Work by Principal Investigators and co-investigators (>60): • Climatology, inter-annual variability, tendencies • Stratosphere-Troposphere Exchanges • Transport and transformation of pollution on global scale • Validation of chemistry-transport models and regional air quality models • Validation of satellite sensors for the atmospheric chemistry • Aircraft impact on the atmosphere • Regional air quality • Literature: • > 150 publications in international journal since 1997 • IGAC Newsletter N°37 (Cammas et al., 2008 ; Volz-Thomas et al., 2008) • All references may be found on the MOZAIC web site (http://mozaic.aero.obs-mip.fr)
Selection of the MOZAIC « best » results : • Thanks to the definition of the program : • Statistics • Specific locations (Africa, Asia, UTLS) • Accuracy and precision of in situ data (CO profiles) • Different from results based on : • Aircraft campaign • Satellite data • Sondes network • A few topics : • H2O, O3, CO, NOy global distributions • Impact of boreal fires in the UTLS • New data over Africa and China • European Summer Heatwave in 2003 (Tressol et al., ACP 2008) • MOZAIC use in GEMS, MACC and future GAS (Ordonez et al., ACPD 2009) • Tropopause and STEs (Brioude et al., JGR 2006, 2008) • Focus on O3 & CO « trends » in the UTLS
Quasi global climatologies In the troposphere and in the UTLS: H20, O3, CO, NOy
MOZAIC Relative Humidity in UT over North Atlantic: comparison with ECMWF ECMWF-MOZAIC • MOZAIC provided the first climatology of UTH • UT is much wetter than assumed before MOZAIC • ECMWF does not reproduce ice super saturation Gierens et al., 1997, 1998, 1999, 2004 ; Spichtinger et al., 2002, 2003 MOZAIC H20 PI : Herman Smit at FZJ julich, Germany
MOZAIC is watching on both sides of the tropopause Example over New York City, for the year 1997 5 flight levels : 196, 216, 238, 262, 287 hPa - 150 hPa LS - 45 hPa - 15 hPa Tropopause, PV=2 + 15 hPa UT + 75 hPa Thouret et al. ACP, 2006 North of 25°N
Thouret et al. ACP, 2006 • Seasonal maximum in spring in the LS (O3>150 ppb), in summer in the UT (O3<100 ppb) • Intermediate seasonal cycle and O3 concentration at the tropopause
O3 in the Upper TroposphereClimatology: 1994 - 2004 • O3 : summer maximum in the UT • Higher concentrations of both O3 and CO in the eastern hemisphere • The Black Sea region is characterized by an O3 maximum and a CO minimum (strong stratospheric influence ?) Winter (DJF) Summer (JJA) Adapted from Thouret et al., 2006
O3 in the Lower Stratosphere Climatology: 1994 - 2004 Spring maximum in the LS Summer (JJA) Winter (DJF)
CO in the Upper Troposphere • CO : maximum in spring or in summer (if boreal fires) in the UT • Higher concentrations of both O3 and CO in the eastern hemisphere • The Black Sea region is characterized by an O3 maximum and a CO minimum (strong stratospheric influence) • CO maxima over burning regions (West Africa in DJF, Central Africa in JJA) Winter (DJF) Summer (JJA) Thouret et al., in preparation
CO in the Lower Stratosphere • no clear seasonal cycle in the LS Winter (DJF) Summer (JJA)
NOy in the Upper Troposphere (MOZAIC 2001-2008) Enhanced NOy over USA and Europe in summer is due to convective transport and lightning Up to 3 ppb NOy (average!) Not reproduced by CTMs ! No significant enhancement in flight corridor during winter < 0.5 ppb NOy Volz-Thomas et al., 2009 : in preparation
Impact of boreal fires in the UTLS High CO concentrations in the UTLS
Biomass fires over Northeastern Asia in Spring 2003: evidence of daily extreme CO concentrations in the upper troposphere with MOZAIC observations Nédélec et al., GRL, 2005
Seasonal signature of plumes of biomass fires injected in the upper troposphere over Northeastern Asia in 2003: comparison with Europe Nédélec et al., GRL, 2005 - Very high CO in the UT between April and August, much higher than what observed over Europe… even during the summer heat wave. - 2003 is clearly anomalous …
Interannual variability of plumes of biomass fires injected in the upper troposphere over Northeastern Asia : 2002-2006 • Direct impact on O3 distribution ? • - Global effect ? CO O3 • CO anomalies in the UT: • Aug-Dec 2002 • Apr-July 2003 • Feb 2006 ??? • CO anomalies in the LS : • - July 2002,03,05 only
Injection in the lower stratosphere of biomass fire emissions followed by long-range transport: a MOZAIC case study 300 MOZAIC time series shows an ozone-rich upper-level trough with embedded CO peaks over Eastern Atlantic 200 100 Backtrajectories on 5 days indicate that a likely source of CO plumes is over the region west of Great Bear Lake over Northwest Territories of Canada on 25-27 June 2004 MODIS image, June 24, 2004 Meso-NH runs : did reproduce injection in LS Cammas et al., ACP, 2009
MOZAIC over Africa since 1997 Some of the main African O3 precursors: biomass burning, biogenic VOCs, and LiNOx Dec. – Jan. – Feb. Jul. – Aug. – Sep. ATSR biomass fire detection Lagos: ~400 MOZAIC profiles Brazzaville : ~200 MOZAIC profiles LIS lightning detection MOZAIC transect by Air Namibia : Daily flight since 2006 Sauvage et al., ACP 2005, JGR 2006, ACP 2007
Ozone distribution in the upper troposphere MOZAIC measurements over West Africa (9-12 km) Seasonal mean JJA over the period 1997-2004 Ozone (ppbv) HR (%) V(m/s) 100 80 4 50 0 -4 Sauvage et al., GRL 2007 0 0 -10 10 20 30 Latitude Ozone meridional gradient with min. at the latitude of the ITCZ (7°N) What are the relative contributions - of the photochemical production of ozone and of the transport ? - of the surface sources and of the source of NO from Lightning ? => 2D study in the latitude-altitude reference to assess the role of Lightning Bilan O3P - Mai 2009 25
Meridional Distribution : Analysis with the meso scale model Meso-NH sources of O3 (ppb/hour): without LNOx with LNOx • Chemical Production = maximun where NOx maximum • Convection = source of O3 poor air in the UT => minimum • LNOX => keep high P(O3) in the branches => gradient Saunois et al, JGR 2008
Africa: continent of large ozone variability !! Three years of daily transects (50°N-20°S) in the UT over Africa Sept. - Oct. - Nov. Large ozone variability in the upper troposphere, observed at all seasons. Variability of sources, convective transport, large-scale transport pathways Cammas et al., in preparation
Long-range transport of biomass burning plumes over Windhoek (Namibia) Influence of South American fires In the UT over austral Africa Biomass Burning Plume MOZAIC vertical profile over Windhoek, 05/09/2006 Retroplume of air parcels sampled inside the biomass burning plume over Windhoek (see MOZAIC vertical profile on left figure) within the lower troposphere (0-3 km altitude) and during the period August 29-23, 2006. Grey circles: biomass fires detected by MODIS during the period of interest. Cammas et al., in preparation
Tropospheric ozone climatology over Beijing Comparisons of mean profiles O3 profiles in the lower troposphere over Beijing 1995-1999 and 2000-2005. The solid lines are annual mean values, and the dashed lines on the right hand side represent the data collected in summer afternoons at local times 15h-16h in May-June-July Ding et al., ACP, 2008
5 to 20 ppbv more in the PBL probably due to the increase of precursors emmisions in the city of Beijing: Example : ~3 times more cars in 10 years ! No similar « trend » over Paris, New York or Tokyo ! Effect of emissions regulations ? Ding et al., ACP, 2008 Collaboration established to further study data over Hong Kong and Shangai
CO vertical profiles over Beijing and Tokyo (compared to Frankfurt) ~1000 ppb ~2000 ppb • Still High CO in China • High CO in the UT over Tokyo : • Export from continental Asia (boreal fires ?) • Very high CO up to 4-6 km altitude • over Beijing. • Tokyo, quite similar to Frankfurt
Focus on UTLS, longer term variabililty and trends • Already published manuscripts : • Bortz et al., JGR 2007 (Upper Tropical Troposphere: O3 increase of ~1 ppb/yr) • Thouret et al., ACP 2006 (UTLS North Atlantic, O3) • Koumoutsaris et al., JGR 2008 (Geos-Chem CTM) • Schnadt et al., ACP 2009 (GASP, MOZAIC and sondes, better see following talk by Johannes Staehelin) • An update with CO and O3 recent MOZAIC data
Characteristics of the first 10 years of MOZAIC measurements In both UT&LS : The 1998-1999 anomaly Europe 1.00 +/- 0.99 %/yr 1.99 +/- 1.21 %/yr UT LS Thouret et al., ACP 2006
Same behaviour over the eastern US in both UT&LS : The 1998-1999 anomaly Eastern US 0.99 +/- 0.82 %/yr 0.80 +/- 1.06 %/yr UT LS Thouret et al., ACP 2006
O3 increase of about 1%/year in both the UT and the LS : Causes : global anthropogenic pollution and large scale modes of atmospheric variability. Transport and circulation anomalies in 1998-1999 ? Correlations with NAO in the UT and NAM in the LS : Strong interannual variability partly linked to the variability of the tropospheric and stratospheric circulation, same anomalies strong coupling between UT and LS Thouret et al., ACP 2006
The 1998-1999 anomaly as seen by GEOS-Chem over the period 1987-2005 GEOS chem over US East • A non negligeable influence of the extreme El Nino event in 1997 through : • STEs • Asian pollution export and transport toward Europe because of a change in convective activity in East Asia and a strenghtening of the subtropical jet stream Koumoutsaris et al., JGR 2008
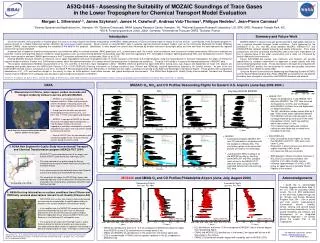
Latitude range Longitude range Number of flights 1- US east 35°N - 50°N 90°W - 60°W 14 412 (5 203) 2 North Atlantic 50°N – 60°N 50°W – 20°W 10 703 (3 300) 3- EU west 45°N – 55°N 15°W – 15°E 22 935 (8 216) 4- West. Medit. 35°N – 45°N 5°W – 15°E 6 298 (2 657) 5- Black Sea 35°N – 45°N 25°E – 55°E 9 323 (3 097) 6- East Asia 40°N – 65°N 100°E – 140°E 5 472 (1 596) Regions quite well documented to assess the interannual variabilities and first decennal trends of O3 (1995-2009) & CO (2002-2009) O3 (CO) O3 (CO) Work in progress …
EU west USA East LS UT consistent with Mace Head time series…. !!! By chance or does it Mean something ? 2 periods : 1995-2000 (O3 increase) and 2001-2009 (levelling off) In both regions, in both UT & LS
Black sea East Asia LS Not consistent with caucasian site…. Comparable ? UT Different behaviour : O3 increase in the UT almost no trend in the LS Max of O3 increase in the UT over Asia since 2001 Still 1998-1999 anomaly in the LS (global NH feature)
CO in the UT USA East EU west Black sea East Asia CO from 2002 : general decrease in the UT, even over Asia (not significant More the effect of spring-summer 2003). Largest decrease over the US. Overall min over Black Sea and max over Asia.
Summary : Linear Fit (%/year) : O3 CO UT LS UT LS US east 0.61 +/- 0.48 * 0.36 +/- 0.67 * - 1.56 +/- 0.79 1.14 +/- 0.86 * North Atlantic 0.39 +/- 0.51 * 0.30 +/- 0.65 * - 0.76 +/- 0.91 * 0.43 +/- 0.73 * EU west 0.77 +/- 0.44 0.28 +/- 0.65 - 1.11 +/- 0.69 * 0.35 +/- 0.61 * Med west 1.38 +/- 0.68 0.13 +/- 0.86 * 1.65 +/- 1.46 * 2.77 +/- 1.75 Black Sea 1.63 +/- 0.59 0.11 +/- 0.76 * - 1.09 +/- 0.86 * - 0.09 +/- 0.82 * East Asia 0.99 +/- 0.61 * 0.83 +/- 0.71 * - 1.14 +/- 1.58 * - 2.13 +/- 0.66 1994-2003 : Thouret et al., ACP 2006 1994-2007 : * Are not statistically significant Thouret et al., EGU 2009
Interannual variabilities and first decennal trends over selected regions • O3 • General increase in the UT : ~0.7 to 1.6 %/yr (dep. on the lenghth of the time series and regions) • Largest and linear increase over the Western Medit., Black Sea and East Asia • Levelling off over EU west and US east after 2001 • No significant signal in the LS (zonal homogeneity)– before or after 2000-2001 ? • 1998-1999 anomalies still characterize the time series (influence of the strong El-Nino in 1997 at hemispheric scale ?) in both UT and LS • CO in the UT • General decrease (even over Asia) : ~ -1%/yr : how come ? • Largest decrease over USA East • Positive anomalies: 2002 (global, biomass burning), over Asia in 2003 and over Med West in 2007 • How to go further and attribute (quantify) causes ?
Conclusion • MOZAIC (1993-2009) has demonstrated : • High quality data of regular measurements • Case studies and Statistical analysis • Complementarity to other networks of in situ data (sondes, research aircraft campaigns, surfaces sites) • Validation of Models and Satellites • Long term feasability and « low cost » data base (~500 €/flight including 2 profiles) • MOZAIC will become IAGOS from 2010 on… ! • New measurements (Cloud droplets, NOx, CO2, CH4, Aerosols), more aircraft (20), NRT transmission of data • Longer time scale (20 years), new sampled regions (Pacific with China Airline and Cathay Pacific involved)
H2O, O3, CO, CO2 NOy, NOx, aerosol, cloud particles H2O, O3, CO, NOy MOZAIC publications H2O, O3 IAGOS MOZAIC 1993 2001 2005 2012 CARIBIC In-service Aircraft for a Global Observing System European Research Infrastructure IAGOS will form a cornerstone of IGACO/GEOSS and of the European GMES initiative www.iagos.org
Thanksfor your attention … thov @ aero.obs-mip.fr http ://mozaic.aero.obs-mip.fr http://www.iagos.org
Changes in the Tropopause region (O3 and H2O trends) Spatial and temporal resolution Higher resolution than satellites (UTLS) Higher frequency than Ozone-sondes Validation of Climate Models and Satellite Retrievals Tropospheric profiles of CO, CO2, NOx, aerosol, .. Global Air Quality Profiles of NOx, Aerosols Influence of developing regions International Transfer Standard Same systems everywhere Regular Quality Assurance Cost effective 500 €/flight including 2 profiles Equip 10-20 longhaul aircraft with scientific instruments for: chemical composition (H2O, O3, CO, CO2, NOx, NOy), aerosol and cloud particles Longterm deployment Global coverage (same instrument) Open data policy Near-realtime data provision to GMES-GAS and Met Services Objectives Scientific Value
IAGOS INLETS IAGOS instrumentation Package 1 (72 kg) Basic & mandatory system O3 CO Relative humidity Cloud droplets and ice crystals Meteorological parameters Data acquisition and transmission Package 2 (50 kg) Optional extra 2a : NOy 2b : (NOx = NO + NO2) 2c : Aerosol (>2012 ?) 2d : CO2 + CH4 (>2012 ?)
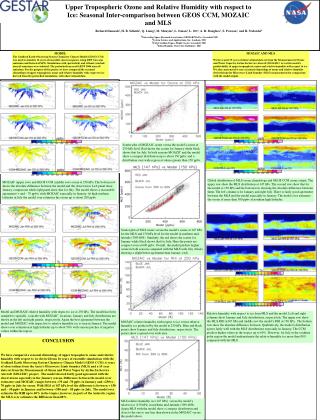
Ozone Instrument validation: MOZAIC + ozone sounding at Hohenpeissenberg (48°N, 11°E) • MOZAIC O3 instrument: improved version of commercial dual-beam UV absorption instrument (Thermo-Electron, model 49-103), • Accuracy 2 ppbv / precision 2% / response time 4 sec • -Sensor replacement & pre- and post-calibration in laboratory every 6-10 months, with NIST • Automatic calibration in flight (zero Ozone generator) • To make sure there is no derive ! • Marenco et al., JGR, 1998 Seasonal variations of ozone monthly averages for the Hohenpeissenberg sounding station [1980-93] compared with MOZAIC data over Frankfurt [Sept 1994-Aug 1996] at 5 standard pressure levels. Standard deviations are plotted as error bars with large cap for MOZAIC and small cap for Hohenpeissenberg. MOZAIC is 3-13 % higher than sondes data Thouret et al., JGR, 1998

![Midlats: MOZAIC [40-60N, 0-75 W] 250 hPa layer](https://cdn2.slideserve.com/3925151/slide1-dt.jpg)