Download
1 / 61
620 likes | 737 Vues
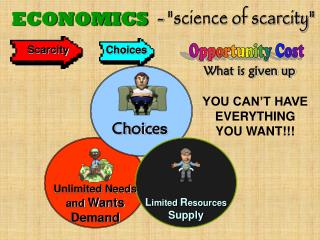
ECONOMICS. CRUNCH KIT. BASICS OF ECONOMICS. § Human wants are unlimited, but goods are scarce § There are no free lunches; you can never get something truly free (due to the cost of time, and other costs) § To get one thing, we must give up another § Humans behave rationally in economics

E N D
ECONOMICS CRUNCH KIT
BASICS OF ECONOMICS • § Human wants are unlimited, but goods are scarce • § There are no free lunches; you can never get something truly free (due to the cost of time, and other costs) • § To get one thing, we must give up another • § Humans behave rationally in economics • § The full cost of an action includes its opportunity cost • § Opportunity cost: value of the next-best alternative
RATIONALITY • § Marginal cost: cost of producing/consuming ‘‘one more’’ • § Marginal benefit: benefit of producing/consuming ‘‘one more’’ • § Rational agents will produce or consume a good until marginal cost = marginal benefit/revenue (MC = MR) • § Rational consumers maximize their utility, or satisfaction; rational firms maximize their profits
POSITIVE VS. NORMATIVE • § Positive: ‘‘What is’’ (taxes are 20%) • § Normative: ‘‘What should be’’ (taxes should be lower)
MICRO VS. MACRO • § Microeconomics: focuses on individual decision making; works its way up from individuals to markets to economies • § Macroeconomics: focuses on the economy as a whole; tracks economy wide variables; takes a top-down approach
COMPARATIVE ADVANTAGE • § Comparative advantage: being able to produce a good at a lower opportunity cost than anyone else • § Absolute advantage: being able to produce a good more • efficiently than everyone else • § An individual can have an absolute advantage in everything, but NOT a comparative advantage in everything • § Agents should specialize in what they have a comparative advantage for, and then everyone will benefit from trade
THE PRODUCTION POSSIBILITIES FRONTIER (PPF) • A PPF shows all of the ways an economy can produce goods • § Each axis features a good; the PPF measure trade-offs between these two goods • § All points outside the curve are impossible to produce at • § Points inside the curve are possible but inefficient and do not use all available resources
PARETO EFFICIENCY • Something is Pareto efficient if it is impossible to improve well-being without hurting someone else • § Pareto efficiency provides no way to judge the superiority of one distribution versus another
PERFECTLY COMPETITIVE MARKETS • § The good being sold must be highly standardized • § Large number of buyers and sellers • § Everyone is well informed about the market price • § No barriers to entry exist; new firms enter easily • § Everyone is a price taker
DEMAND • § Law of demand: the quantity demanded of a good decreases when the price increases and vice versa • § Demand: this relationship between prices and quantities for a particular market • § Quantity demanded: the amount demanded at a given price • § Demand can shift due to consumer income, substitutes and complements, the number of consumers, and consumer preferences and expectations
SUPPLY • § Law of supply: the quantity supplied of a good increases when the price increases and vice versa • § Supply: relationship between prices and quantities for a particular market • § Quantity supplied: the amount supplied at a given price • § Supply can shift due to changes in factor costs, technology, expectations of future prices, number of producers, and government regulations
ELASTICITY • § Percent change in quantity over percentage change in price • § Price elastic demand: goods with close substitutes, luxuries • § Price inelastic demand: necessities • § Price elastic supply: long run • § Price inelastic supply: short run, scarce good • § Factors affecting demand elasticity: substitutes, necessities, scope of market, time horizon • § Factors affecting supply elasticity: scarcity of inputs, presence of barriers to entry, time horizon
MICROECONOMIC EQUILIBRIUM • § Equilibrium: intersection of supply and demand • § Consumer surplus: difference between how much consumers are willing to pay and the market price • § Producer surplus: difference between the price at which firms are willing to sell and the market price • § Market equilibrium maximizes consumer and producer
THREE FUNDAMENTAL QUESTIONS OF ECONOMICS • How much should be produced? • Who should produce the good? • Who should receive the good?
ECONOMIC AND ACCOUNTING PROFIT • § Total revenue: amount a firm receives from selling its goods • § Total cost: costs of a firm supplying its goods • § Accounting cost: actual monetary cost • § Accounting profit: straight monetary profit earned • § Economic cost: both monetary (accounting) cost and the opportunity cost of the resources used • § Economic profit: monetary profit minus opportunity cost; always equal to zero in the long run
FIRMS AND COSTS • § Fixed costs: costs that a firm must pay regardless of how • much it produces (rent, utilities); only fixed in short run • § Variable costs: costs that change with the amount produced • § Average cost: the sum of fixed costs and total variable costs, divided by the total number of units produced • § After a certain point, marginal costs stop decreasing and begin increasing-----this is called diminishing returns to scale • § In the long run, all costs are variable
PRICE CONTROLS • § Price ceilings set a maximum; price floors set a minimum • § Deadweight loss: lost efficiency due the market not being in equilibrium • § Binding price controls ALWAYS have deadweight losses • § Price controls transfer surplus from consumers to producers or vice versa • § Taxes distort the market, transferring surplus from the market to the government at the expense of efficiency • § The more inelastic party always bears more of the tax • § Revenue equals price times quantity
MARKET FAILURES • § A market failure is when competitive markets fail to produce socially desirable outcomes • § Two types discussed here are externalities and public goods
EXTERNALITIES • § Externalities are costs or benefits that affect a third party uninvolved in the activity or transaction in question • § Individuals do not factor externalities into their decisions since they do not pay the costs or reap the rewards • § Negative externalities harm third parties; the tendency is to overproduce them • § Positive externalities benefit third parties; there are not enough of them
PROPERTY • § Coase Theorem: private parties can resolve the inefficiencies created by externalities as long as property rights are clearly defined and all parties can negotiate with each other • § A rival good, when it is consumed, can no longer be consumed by anyone else • § People have limited access to excludable goods • § Private goods are both rival and excludable • § Public goods are neither • § Collective goods are non-rival and excludable • § Common resources are non-excludable and rival • § The tragedy of the commons occurs when people overuse a resource because no one owns it
MARKET POWER • § A firm with a downward sloping demand curve has market power; they can choose their price • § The combinations of price and quantity available to choose from are determined by the market demand
MONOPOLY • § Market with only one firm • § Produce less than what consumers demand, and sell it at higher than the market price; results in contrived scarcity • § Arise due to the presence of barriers to entry • § Price discrimination: charging different customers different prices; a monopoly can capture more of the consumer surplus for the firm
OLIGOPOLY • § Market with only a few firms • § Collusion: when firms cooperate to artificially raise market prices by restricting supply • § Cartel: group of firms that collude • § Cartels often break up due to an incentive to cheat
MONOPOLISTIC COMPETITION • § Firms compete through product differentiation, not price competition • § Few barriers to entry exist • “BRAND” MONOPOLY, but not product monopoly
INSTITUTIONS, ORGANIZATIONS, AND GOVERNMENT • § Institutions: formal or informal rules that guide human interactions • § Organizations are like institutions but more formal • § Governments can tax their citizens and use force • § Pork barrel politics: elected officials tend to steer money to their constituents by introducing projects • § Logrolling: vote trading among elected officials • § Rent seeking: socially unproductive activities that simply direct economic benefits
GROSS DOMESTIC PRODUCT (GDP) • § Market value of all final goods and services produced within a country in a given period of time; four components • § GDP = Y = C + I + G + NX • § Consumption: consumer spending on final goods • § Investment: value of all money spent on capital or technology • § Government expenditures • § Net exports: exports minus imports • § Business cycle: fluctuations in GDP over recessions and expansions • § Average labor productivity: GDP divided by the total number of workers employed
MACROECONOMIC MODELLING • § Circular flow model: households own factors of production; firms rent factors and produce goods, which households buy; two markets: goods market and factor market • § Aggregate demand (AD): quantity of goods demanded by an economy at different price levels, slopes downward • § Aggregate supply (AS): potential supply of goods and services in an economy at different price levels • § Short run aggregate supply (SRAS): slopes upwards • § Long run aggregate supply (LRAS); fixed at full employment output; vertical line; independent of price level • § Short run equilibrium: intersection of SRAS and AD; long run equilibrium is at the intersection of all three curves
UNEMPLOYMENT • § Labor force: all individuals 16 or over, not in prison or armed forces, and actively looking for work or has a job • § Employment rate: percentage of labor force with a job • § Participation rate: percentage of population in the labor force • § Structural unemployment: unemployment due to large shifts in economy; mismatch between skills demanded and skills supplied • § Cyclical unemployment: caused by the business cycle • § Frictional unemployment: natural unemployment due to timelag between jobs • § Unemployment rate calculated every month by the BLS • § Natural rate of unemployment: never 100%; structural + frictional unemployment • § Okun’s Law: for every 1% increase in unemployment, GDP drops by 2%
MONEY • § A medium of exchange, unit of account, and store of value • § Commodity money: money with intrinsic value • § Fiat money: intrinsically worthless; declared valuable by gov’t • § Inflation: rise in price level; decrease in purchasing power of money; measured by the CPI and GDP deflator • § Liquidity: how easily an asset can be converted into currency
THE FINANCIAL SYSTEM • § Savings: income that is not spent • § Investment: purchase of new capital equipment • § Bond: a certificate of indebtedness • § Stock: ownership of a portion of a company • § Net capital outflow: domestic purchase of foreign capital minus foreign purchase of domestic assets
FISCAL POLICY • § Government spending or taxes to influence AD • § Contractionary: increasing taxes, decreasing spending • § Expansionary: decreasing taxes, increasing spending
MONETARY POLICY • § Open market operations: buying or selling securities, done by the FOMC • § Reserve ratio: fraction of deposits banks must keep in reserve; adjusted by Board of Governors • § Discount rate: interest rate the Fed charges to member banks; adjusted by Board of Governors • § Contractionary: selling securities, increasing reserve ratio, increasing discount rate • § Expansionary: buying securities, decreasing reserve ratio, decreasing discount rate • § Quantity theory of money: MV = PY or MV = PQ
THE ECONOMICS OF RUSSIA • § Russia transformed into a planned economy after the Russian Civil War • § The Soviet Union, an economic union of 15 nations, operated under strict bureaucratic planning • § Flawed planning mechanisms caused chronic shortage • § Mikhail Gorbachev launched perestroika, restructuring of the communist system, but worsened the economy • § Gorbachev was ousted and the Soviet Union collapsed in 1991 • § Boris Yeltsin, Russia’s first elected president, successfully privatized most of the economy • § Vladimir Putin entered office as global oil prices rose and the Russian economy prospered • § Dmitri Medvedev entered office shortly before the 2008 global financial crisis • § He pursued ‘‘modernization’’ efforts
Economists • Michael Boskin • In 1996, assigned to head a committee to review the methods used to calculate CPI • Michael Edelstein • Constructed the ‘‘marginal’’ and ‘‘strong’’ set of standards to gauge the effect of empire ion the British economy • Stanley Engerman • Estimated profitability of the slave trade • Milton Friedman • Most famous advocate of monetary policy (instead of Kenyesian policy)
John Maynard Keynes • Proposed fiscal policy as a way to smooth out the business cycle; his theories put to the test in the Great Depression; wrote 1936 book • The General Theory of Employment, Interest, and Money • Simon Kuznets • Commissioned by the U.S. Department of Commerce to develop a system to measure national output • Joseph Schumpeter • Described the impact of entrepreneurs as ‘‘creative destruction’’ • Adam Smith • Father of classical economics; wrote the 1776 book • An Inquiry into the Nature and Causes of the Wealth of Nations
Okun, Arthur • One of President Kennedy’s chief economic advisors in the early 1960s; articulated OKUN’S LAW • Every 1% that the unemployment rate is off from the natural rate of unemployment, the output gap deviated by 2% • Pareto, Vilfredo • Italian economist (1848-1923); first came up with the concept that an outcome was efficient only if there was no way to improve someone’s well-being without reducing someone else’s well-being
COMMENTARY: • Aslund, Anders • Two-thirds of national employment must be private • Colton, Tim • Bureaucratic planners were unable to anticipate the need for computerization • Gontmakher, Evgeny • Russia’s economic woes are ‘‘a result of incorrect economy policy, oil dependence, and rampant corruption.’’ • Hanson, Philip • Noted that rising global prices of oil and gas indirectly fueled Russian economic growth (with negative consequences) • Kornai, Janos • The distinction between national and regional firms in the Soviet Union was meaningless: ‘‘Servility and a heads down mentality prevailed’’
RUSSIANS • Gaidar, Yegor • Primary author of the “shock therapy” reform enacted by Boris Yeltsin, acting prime minister of Russia under Yeltsin • Gontmakher, Evgeny • Analyst; commented on Russia’s experience with the resource curse. He stated, “This is all a result of incorrect economic policy, oil dependence, and rampant corruption, Until the system changes, these problems will persist.”
Shatalin, Stanislavand GrigoryYavlinsky • Economists and Gorbachev advisors; helped produce the 500 Day Plan • Chubias, Anatoly • economist; Yeltsin’s first privatization czar; started the program • Polevanov, Vladimir • Russia’s Minister of Privatization during Boris Yeltsin’s presidency who halted Yeltsin’s second stage of privatization, advocated renationalization of some firms
PERCENTAGES -20% to 10% • -17% • (111) Percent growth of the Soviet Union’s GDP by the time of its collapse in 1991 • -0.2% • (119) Percent growth of Russia’s GDP in 2009 • 2% • (118) Percent growth of Russia’s oil production in 2007 • 3% • (111, 118) Percent growth of Russia’s GDP in 1989 • Percent growth of Russia’s oil production in 2006 • 5% • (118) Percent growth in Russia’s oil production in 2005
PERCENTAGES -10% to 10% • 6% • (119) Russia’s unemployment rate in 2008 • 9.7% • (72) The United States’ unemployment rate in August 2009 • 10% • (110, 118, 119) • Yearly percent decline in Russia’s production between 1989 and 1991 • Percent growth in Russia’s oil production in 2004 • Increase in Russia’s real disposable income between 1999 and 2008
10% - 25% • 12% • Russia’s unemployment rate in 1999 • Percent of Russians living on subsistence minimum in 2008 • 13% • Flat income tax rate imposed by Vladimir Putin during his first term (2000-2004) • 16% • (86, 119) Decline in the United States’ CPI from 1920 to 1922 • Percent decline in Russia’s industrial output between October 2008 and February 2009, according to Bank of America Securities-Merrill Lynch
10% - 25% • 19% • (118) Percent of Russia’s oil coming from state-owned firms in 2004 • 20% • (114) Average percent of shares sold by each firm during Boris Yeltsin’s voucher program • 24% • (117) Russia’s tax rate on profits after Vladimir Putin’s tax cuts • 25% • (86, 114) Decline in the CPI from 1929 to 1933 • Percent of insider ownership allowed under Boris Yeltsin’s voucher program
25% - 50% • 28% • (119) Decline in Russian government revenue by the first quarter of 2009 • 29% • (114) Percent of shares that had to be sold during the voucher program under Boris Yeltsin’s decree • 35% • (117) Russia’s tax rate on profits before Vladimir Putin’s tax cuts • 41% • (119) Percent of Russians living at subsistence minimum in 1999 • 50% • (118) Percent of Russia’s oil coming from state-owned firms in 2008
50% - 215% • 66% • (72) The United States’ current labor force participation rate • 70% • (119) Percent decline in the value of Russia’s stock market between June 2008 and January 209 • 75% • (115) Percent of Russia’s large and mid-sized firms privatized by 1996 • 90% • (115) Percent of Russia’s industrial output privatized by 1996
50% - 215% • 99% • (107) The Soviet Union’s literacy rate at the time of its collapse • 100% • (111) The Soviet Union’s inflation rate at the end of 1991 Economics Power Guide | 134 • 245% • (112) Average percent increase in prices the day after Boris Yeltsin freed prices on January 2, 1992
FISCAL & MONETARY POLICY TERMS • Contractionary policy • Policy meant to fight inflation and decrease aggregate demand • Discount rate • Interest rate the Federal Reserve charges for loans to its member banks • Expansionary policy • Policy meant to fight recession and increase aggregate demand • Federal funds rate • Interest rates banks charge on loans to each other; based on the discount rate but not set by the Federal Reserve
FISCAL & MONETARY POLICY TERMS • Fiscal policy • Government taxation and spending policy choices meant to influence the economy • Monetary policy • Policies set by a central bank (for us, the Federal Reserve) to accelerate or slow down the economy by increasing or decreasing the money supply, respectively • Open market operations • The trading of government securities by the Federal Reserve to adjust the size of the money supply • Reserve ratio • The amount of each deposit banks must hold in reserve
FORMULAS • Average Total Costs • Total fixed costs + total variable costs total number of units produced • CPI • Basket price in year t x 100 basket price in base yr • GDP Deflator • Nominal GDP x 100 Real GDP
FORMULAS • GDP • C + I + G + X • General Profit Maximizing Condition • MR = MC • Money Multiplier • 1 RR