Download
1 / 35
350 likes | 477 Vues
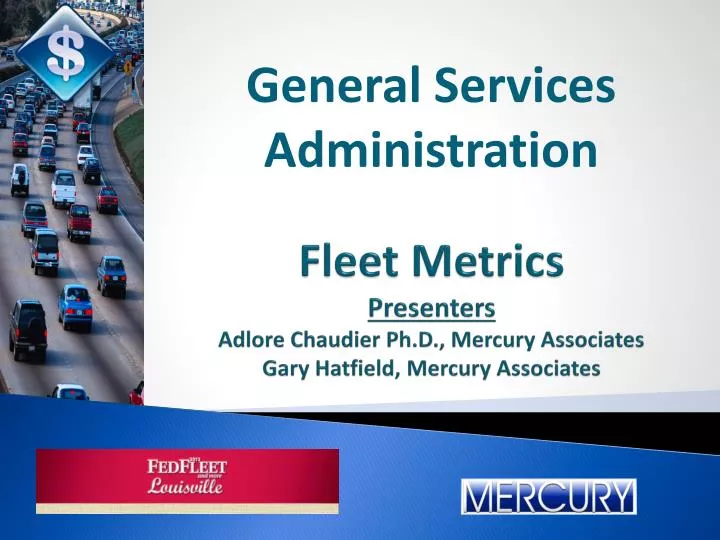
Fleet Metrics Presenters Adlore Chaudier Ph.D., Mercury Associates Gary Hatfield, Mercury Associates. General Services Administration. Why Measure?. “What gets measured, gets done.” – Anonymous. Why Measure?. Because performance measures can:

E N D
Fleet MetricsPresentersAdlore Chaudier Ph.D., Mercury AssociatesGary Hatfield, Mercury Associates General Services Administration
Why Measure? “What gets measured, gets done.” – Anonymous
Why Measure? Because performance measures can: • Help you make a case for more (or fewer) resources • Identify areas where you need to improve • Emphasize your strengths (prove you are doing a good job) • Help you track future performance improvement or decline • Lay the foundation for FAST and other reports
A Good Measure . . . • Is accepted as meaningful • Tells how well goals and objectives are being met • Is simple, understandable, logical, and repeatable • Shows a trend • Is clearly defined • Allows for simple and consistent data collection • Is timely • Drives appropriate action
Important to Remember • Management above the fleet management organization often does not understand the science and complexity of fleet management. • An important Fleet Manager’s responsibility is to establish and communicate key fleet performance measures, their meaning, and significance. • Communicate performance to: • Leadership • Customers • Fleet Employees
If leadership asks, could you answer? • How many vehicles do we have? Types? • Do we have too many vehicles? How do we know? • What's our maintenance cost? By type? • Do all our vehicles receive PM? • Are we competitive with local repair shops? • What is our fleet MPG? By vehicle type? • How many accidents do we have? • How are the numbers trending?
What Is a Metric? • A metric is a quantifiable and repeatable standard of measurement; • A performance metrics program means that you have a process for developing objective sets of data to measure how your fleet is doing relative to goals; • Use the metrics to develop benchmarks, a standard by which you can measure progress (or lack thereof) against past performance • If you don’t know where you’ve been and where you’re going, you won’t know when you’ve gotten there.
Types of Performance Metrics • Cost • Quality of Service • Timeliness of Service • Customer Satisfaction • Conformance with Best Practices • Compliance with Legal Requirements • Contractor or worker performance • Safety • Accidents
So, Which metrics matter? • Basic Fleet • Inventory • Utilization • CPM / CPH (Cost per Mile or Hour) • Maintenance Shop • PM Compliance • Productivity • Scheduled versus Unscheduled • Parts • Fleet Availability • Fuel • MPG • Number of transactions • Alternative Fuel Use
Utilization • Great data driven metric • Right-sizing metric • Establishes a standard justification for assignment • Objective Quantify as: • Miles driven • Hours operated or in use • Number of trips
Utilization • Establish Standard for each class of equipment • Don’t Forget about your off road equipment
Basic Fleet Metrics • Average age of your fleet by Class and Type • Average total miles • Average Miles per Gallon • Average Cost per Mile (or Hour)
Basic Fleet Metric - CPM • Cost Per Mile / Hour – (CPM, or CPH) should include: Ownership (Fixed) Costs • Depreciation • Indirect (Admin – Overhead) Operating (Variable) Costs • Maintenance & Repair Costs • Fuel
CPM • Not all Agencies use depreciation • Use to develop CPM for all classes Total Fixed Cost Per Mile = $0.22 Total Operating Cost Per Mile = $0.16 Total Cost Per Mile = $0.38
Accident Metrics • Fleet accident rate – accidents per million miles • Average repair costs for accidents • Money recovered from programs • Lost time due to accidents
What About Benchmarking? • Benchmarks are trends or comparisons expressed as metrics; • Your current metrics are most valuable when they are compared to another metric or benchmark (provide a historical context); • By capturing and benchmarking metrics, a fleet manager can demonstrate improved performance; • Transform your metrics into trend lines.
This is You How are you doing?
By the Way, This is Where You Were Last Year Downtime Now how do you think you are doing?
Measure Against Standards Downtime Industry Norm
… And How Do You Measure Up Against Best In Class Downtime Best in Class
Benchmarking Steps • Benchmark against yourself (year by year) • Benchmark against peers • Benchmark against industry standards • Benchmark against “best in class”
What do I do with the data? • Use Internal vs. External comparisons • Other Agencies • Contractors • Share the data • Customers • Leadership • Agencies (DOE, GSA)
Performance Metrics Implementation • Develop a plan that describes how you will gather necessary information and calculate the measure. • Establish a suggested performance level for each measure. • Assess performance against the established performance level. • Based on performance levels, as required, take corrective actions to work toward achieving established goals.
Performance Metrics Implementation Develop a detailed description of each factor when building your plan for implementing your performance metric program.
Summary • Establish goals based on the data • Improve process, set goals, measure at determined intervals, and adjust goals if necessary • Don’t be afraid of bad data! • Get customers involved in the process • Establish exception report • High & low cost per mile • High & low utilization • PM compliance • Fuel MPG • Maintenance costs • Metrics can modify behavior • Never let it become personal
Remember… “There is no guarantee of reaching a goal at a certain time, but there is a guarantee of never attaining goals that are never set.” David McNally in Even Eagles Need a Push
MERCURY ASSOCIATES, INC. “Specializing in the science of fleet management.” For more information, contact: Adlore Chaudier Ph.D. Director, Federal Fleet Consulting achaudier@mercury-assoc.com 262-215-5566 (cell) Gary Hatfield Director, Public Sector Fleet Consulting ghatfield@mercury-assoc.com 941-685-6907 (cell)