Download
1 / 17
170 likes | 316 Vues
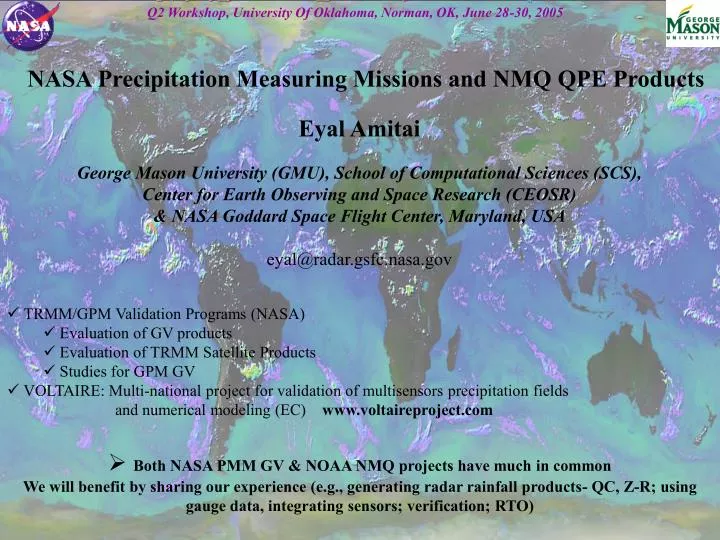
Q2 Workshop, University Of Oklahoma, Norman, OK, June 28-30, 2005. NASA Precipitation Measuring Missions and NMQ QPE Products. Eyal Amitai George Mason University (GMU), School of Computational Sciences (SCS), Center for Earth Observing and Space Research (CEOSR)

E N D
Q2 Workshop, University Of Oklahoma, Norman, OK, June 28-30, 2005 NASA Precipitation Measuring Missions and NMQ QPE Products Eyal Amitai George Mason University (GMU), School of Computational Sciences (SCS), Center for Earth Observing and Space Research (CEOSR) & NASA Goddard Space Flight Center, Maryland, USA eyal@radar.gsfc.nasa.gov • TRMM/GPM Validation Programs (NASA) • Evaluation of GV products • Evaluation of TRMM Satellite Products • Studies for GPM GV • VOLTAIRE: Multi-national project for validation of multisensors precipitation fields and numerical modeling (EC) www.voltaireproject.com • Both NASA PMM GV & NOAA NMQ projects have much in common We will benefit by sharing our experience (e.g., generating radar rainfall products- QC, Z-R; using gauge data, integrating sensors; verification; RTO)
Does NASA/TRMM have any needs/requirements for NMQ products? • What NASA/TRMM products may improve NMQ products? • NMQ is a great project and TRMM/GPM scientists will use its products for different applications: • Verification of TRMM Satellite Observations • R area coverage • Diurnal cycle • Total R • PDF (R)
NASA “Requirements” for Validation Products • A value without an uncertainty value is not much of a value TRMM era: • Product generation and product comparison • GPM era: • Error structure characterization and uncertainties determination in near- real-time, and understanding the processes that lead to these uncertainties • ‘10% error @ monthly 300km x 300km’ (GPM Project Scientist) • Radar gauge adjustment fields • Radar calibration shifts <1 dB • QC, QC and QC [exp. AQC] • Super dense gauge network for verification • Focus on instantaneous products [exp. PDF comparisons]
‘A value without an uncertainty value is not much of a value…’ • Data assimilation and many hydrologic applications require satellite observations of precipitation. However, providing values of precipitation is not sufficient unless they are accompanied by the associated uncertainty estimates. While this principle is well known, and that the main approach of quantifying satellite precipitation uncertainties generally requires establishment of reliable uncertainty estimates for the GV products, we must remember that much research remains to be done before a map of probable error can be estimated and presented alongside the GV radar rainfall map in real time, and yet this has to be considered an important scientific goal. Therefore, the GV uncertainties might be very large and in many cases even larger than the satellite uncertainties. If GV uncertainty values > Satellite uncertainty values do we need GV?
<R>Sat <R>GV If GV uncertainty values > TRMM uncertainty values do we need GV? YES (in some cases)! The overlap zone of both uncertainties might bring us closer to the truth even if the satellite algorithm-based uncertainties are smaller than those of the reference products
Distribution of Error Estimates Distribution of monthly GV radar (R)-gauge (G) accumulation differences based on 6,153 values, during 12/1997-06/2004 in Central FL • 6,153 gauge-months --> 585,760 mm • R/G=1.008; r=0.95 • NMAD=S|Ri-Gi|/S Gi= 0.17 • (R-G)/G positive skewed --> (R-G)/(R+G); Mean=0.0; Std. Dev.=0.13 (0.09) • RD=|R-G|/G; Mean RD=0.20 (0.15); Median RD=0.15 (0.12) • Max freq of RD @ RD=0 • Tails are associated with low rain accumulations: For the 1,538 gauge-months associated with the highest rain accumulations (the top 25% G), see the values in red. • Natural variability of rainfall and gauge instrumental error combined responsible for keeping the radar-gauge NMAD above 0.15 (validation issue) • Inter-annual radar calibration shifts primary factor in obtaining higher monthly radar-gauge NMAD values (Kwaj).
Independent Gauge Networks for Evaluating GV Rainfall Products Comparison of monthly radar rainfall product with independent gauges at Melbourne, Florida Site for August 1998. The radar estimates (TSP 3A-54, version 5) are based on WPMM Ze-R relations using 21 qc-ed gauges within 15-50 km from the radar. • The average difference between the radar estimates over the independent gauges and the gauge accumulations (MAD) is only 8% • MAD of 8% might be explained by the natural variability of rain and gauge instrumental errors • The figure includes several gauges located within the same radar pixel of 2x2 km2. The difference in gauge accumulations within each group (marked by rectangles) is in the same order as the MAD, suggesting Radar accuracy may be higher, but a denser gauge network is required for verification In general, the MAE on a monthly time scale was found to be below 20%. These monthly error statistics were not improved by switching to PMM or with and without rain type classification.
The effect of the AQC algorithm* on the radar rainfall estimates The ratio of the monthly radar estimates derived from the post-AQC dataset to the estimates derived from the pre-AQC dataset, for each month during 1998 at Melbourne.. The number above each column represents the percentage of gauges approved for Ze-R development by the AQC algorithm. Different panels represent different range internals from the radar. *Algorithm to filter unreliable gauge and radar data upon comparison of the G-R merged data, developed by the TRMM Validation program (Amitai, 2000) • When using any gauge adjustment technique for radar rainfall estimation, independent QC of radar and gauge data alone is not sufficient. Proper QC of rain gauge data upon comparison with radar data is essential • AQC increased rainfall by 13%.
Comparing TRMM PR-NEXRAD PDF of Rain RateCentral Florida 1998-2002 (105 overpasses) Comparing TRMM PR-NEXRAD PDF of Rain Rate • Advantage of PDF comparisons • Free of large uncertainties associated with pixel by pixel comparisons • Free of satellite temporal sampling errors associated with the monthly products; • PDF of rain volume by R are less sensitive to instrument thresholds and with a direct hydrological significance Which curve better represents the truth? Dense gauge networks required for better estimation of the true rain rate distribution at the scale of a radar pixel. Distribution of rain volume by R for the Melbourne, FL WSR-88D (GV V5) and TRMM PR V5 datasets based on 105 overpasses during 1998-2002 and co-located GV data of less than 100 km from Melbourne • PR underestimates the rain by 4% compared to GV radar estimates, but also does not detect 4.5% of the rain. When PR detects rain, it compares well with GV estimates NMQ provides larger sample size • Amitai E. et al. 2005: Accuracy verification of spaceborne radar estimates of rain rate.The Royal Meteorological Society Atmospheric Science Letters (ASL),6, 2-6.
1998 V5 1998 V6 Distribution of rain volume by R for the1998 Melbourne, Florida, WSR-88D (GV) and TRMM PR V5 & V6 datasets. V6/V5 PR rain accumulation: 0.77 Which (PR) curve better represents the truth…
A framework for validation of spaceborne estimates of RAmitai et al. 2005: Accuracy verification of spaceborne radar estimates of rain rate.The Royal Meteorological Society Atmospheric Science Letters (ASL),6, 2-6. Framework Features • Demonstrates how a hydrologic approach that uses statistical properties of the precipitation to estimate the uncertainties can be combined with a meteorological approach that uses physical properties of the rainfall • Based on comparing PDF of R from gauge, ground- and space-based radar observations • Includes the use of PDF comparisons after rain type classification. This will allow for 1) better evaluation of the algorithms under different conditions (Physical validation); 2) extrapolation of the uncertainties to regions not covered by validation data sets, but characterized by the same rain types (Globalization) • Focuses on determining and reducing the uncertainties in the GV pdfs (PMM, super dense gauge networks) NMQ allows to verify that uncertainties associate with a given rain type remain the same at different locations
Comparing GV-Satellite PDFs After Rain Type Classification Determining/Reducing Uncertainties in GV PDFs (Using Super Dense Gauge Networks) Refining Classification Scheme Testing Stability of PDFs in Time/Space Determining Relative Errors; Error Characterization Physical Validation Detecting, Quantifying and Reporting Errors in Satellite Algorithms Understanding the Processes Responsible for the Estimate Uncertainties Globalization Extrapolating Uncertainties in Satellite Estimates to Non-GV Regions Characterized by the Same Rain Types
NASA/TRMM Products for Improved NMQ QPE Products
1B-51: Raw radar reflectivity 1C-51: QC radar reflectivity 2A-52: Rain existence 2A-53: Instantaneous rain rate 2A-54: Stratiform/convective rain type 2A-55: Three-dimensional reflectivity 2A-56: Rain gauge data 3A-53: 5-day rainfall accumulation 3A-54: Monthly rainfall accumulation 3A-55: Monthly 3-D reflectivity **All products sent to TRMM Science Data & Information System (TSDIS), then to the Goddard Distributed Active Archive Center (GDAAC)** TRMM GV Data Flow TRMM GVS Radar Data Kwajalein, Melbourne, Houston, Darwin 1B-51 Radar QC QC can be an iterative process 1C-51 2A-54 2A-55 3A-55 Automated, Gauge-adjusted Z-R table creation to use as input for standardized rainfall products 2A-53 3A-53 2A-52 3A-54 2A-56
2A-53 • Input: 1C-51, 2A-54, & gauge-adjusted WPMM ZR table • Output: Instantaneous rain rate (mm/hr) • Data truncated at 150 km • Horizontal resolution: 2 x 2 km2 3A-54 • Input: 2A-53 • Output: Monthly rainfall accumulation • Data truncated at 150 km • Horizontal resolution: 2 x 2 km2
NASA/TRMM Products for Improved NMQ QPE Products TRMM PR : 2A-25 (3-D Reflectivity, Near Surface R)
NASA/TRMM Products for Improved NMQ QPE Products • TRMM GV: 2A-53, 3A-54 • TRMM PR : 2A-25 Additional information regarding TRMM GV climatological product generation, development, and rainfall statistics: http://trmm-fc.gsfc.nasa.gov/trmm_gv/index.html Official TRMM products can be ordered from: http://disc.gsfc.nasa.gov