Download
1 / 25
250 likes | 513 Vues
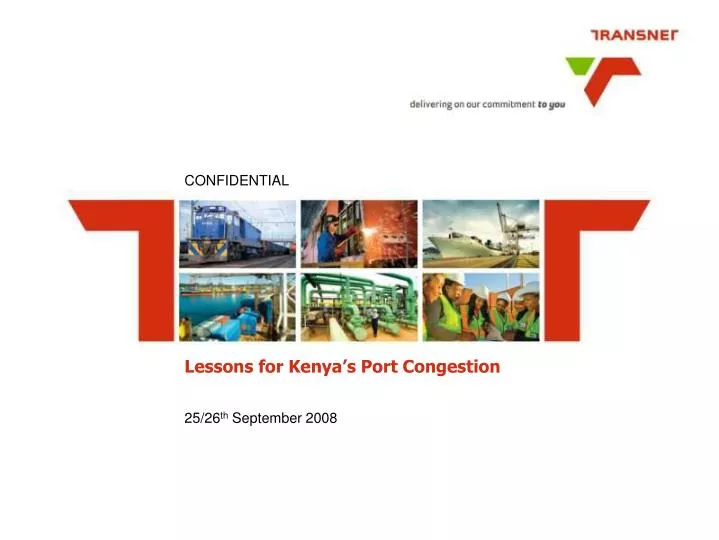
CONFIDENTIAL. Lessons for Kenya’s Port Congestion . 25/26 th September 2008 . AGENDA. South Africa’s Experience in 2001. Lessons learnt in South Africa . Where are we now ?. Ports challenge in Kenya. THE TRANSNET STRUCTURE . There are many views on the definition of CONGESTION ….

E N D
CONFIDENTIAL Lessons for Kenya’s Port Congestion 25/26th September 2008
AGENDA • South Africa’s Experience in 2001 • Lessons learnt in South Africa Where are we now ? • Ports challenge in Kenya
There are many views on the definition of CONGESTION … Is it a back log in vessels waiting at outer anchorage for a berth ? What is congestion? Congestion is defined as the inherent lack of infrastructure, both on the landside and the waterside, that constrains the flow of freight or Is it poor operational performance of the port operator where vessels are not leaving on time ? or Is it the lack of capacity to match the demand which leads to stack congestion Factors that influence congestion or • Inadequate port infrastructure • Insufficient road and rail infrastructure • Poorly integrated supply chains • Low productivity levels, including low productivity Is it the erratic calling of shipping lines to a port that causes bunching of vessels ?
Background to what happened in the South African Ports in 2001 • 2001 : • Volume growth outstripped available capacity • Anti-privatization strikes • Compensation for delays by the Shipping lines– Pre & Post 2001 • 2002 : • Imposition of the $100 surcharge in South Africa by the shipping lines • South African Chamber of Business (SACOB) facilitates meeting between shipping lines, cargo owners & Transnet • Ministers and Director Generals intervene • Establishment of Interim Advisory Board (Name later changed to South African Container Terminal advisory Board - SACTAB) • 2003 : • SACTAB began its work. . .
CHALLENGES WE EXPERIENCED IN 2001/02 • Business performance • Low profitability • High gearing at a Transnet level • Capacity constraints handicapped growth • Investment • A history of underinvestment • No coordinated Transnet investment plan • People • The need to establish a performance culture • Uncertainty regarding concessioning of ports • Industry wide skills shortage • Efficiencies • Low productivity levels. DCT was operating at under 14 container moves an hour • Poor ETA compliance by shipping lines • Shipping lines imposed a US$100 surcharge Source: Team analysis
What led to the Congestion in South Africa in 2001 ? • Primary • Arrival patterns (Capacity vs. Demand) • Equipment failure • Delays • Third party issues (Addressed in following slide) • Secondary • Not enough infrastructure • Lack of inadequate equipment e.g.. Straddle carriers & Cranes • Poor terminal design
Inaccurate ETA’s Inaccurate discharge and load information Late submission of stowage plans by lines Changes in stowage plans On geared cellular vessels ships cranes obstruct gantries from working productively in certain stow positions on vessel Overbooking of vessel’s capacity results in cargo being short shipped and/or rolled over Poor planning of tranships On-berth repairs Bunkering where it affects the operation Not packing exports timorously to meet stack dates Exporters book the same cargo with different lines. Lines therefore submit incorrect export volumes to terminals Not getting import documentation through in time Importing more cargo than can be handled by the importer, results in containers being left beyond the allowed 3 days Unwillingness to work extended hours of production to have export cargo ready within stack times Amending export documentation without informing the shipping line (changing POD, vessel, etc) There is mis-declaration of weights for both imports and exports Last minute requests for COD’s on imports Last minute requests to change port of destination Problems we experienced with the different supply chain partners Shipping Line Issues Importer / Exporter Issues Freight Forwarder Issues Road Haulier Issues • Not processing import documentation timorously including taking release of cargo from Lines / Customs documentation • Use of haulers with non-roadworthy trucks that break down continuously - resulting in late delivery /collection of cargo - both import and export • Submitting CTO’s at the last minute for processing and then handing in 100 CTO’s and wanting them back in 5 minutes • Errors made on CTO’s - incorrect data capture • Illegible writing on hand-written CTO’s • Use of incorrect reference numbers - not the reference given by the Shipping Line - Lines can solve this by carefully checking references before stamping CTO’s • Collecting containers that have not been discharged • Not accepting/packing cargo 24 hours a day 7-days a week creating peaks in traffic arrival at the terminal • Arriving at terminal without necessary documentation • Truckers using false number plates - registering one truck and then sending 3 trucks to the terminal with the same registration plates • Trucks not registered to collect import containers - coming to terminal to collect and then delaying things while their problem is sorted out • Truckers using non-roadworthy vehicles • Unauthorised parking in terminals and in Langeberg Road (Durban) causes congestion • Truckers abandon their vehicles while they attend to other business Source: SACTAB Workshop. 2003
The media had a field day and impacted on the reputation of the SA ports system Sunday Tribune 17 Nov 2002 Business Report 15 Oct 2002 Mercury 29 October 2002 Mercury 13 Nov 2002 Star 13 Nov 2002 Business Day 18 Nov 2002 Mercury 16 Oct 2002 Mercury 14 Nov 2002 Mercury 4 Nov 2002
= Transnet operating divisions Working with government, customers, Ports users and Transnet was the only recipe that would yield positive results INTERIM ADVISORY BOARD Co-chaired by Transnet and the Shipping lines SAAFF (Road haulers) Technical Task Team TPT TFR CLOF (Shipping Lines) Shippers Council (Cargo Owners) NPA Landlord & Marine Services Port Operator Rail Operator Shipping Lines Freight Forwarders Operations Audit Team Cargo owners • This team met every 2 weeks for 2 years • The board defined and set KPI’s of what we wanted to measure each supply chain partner • We had a media black out – Nobody spoke to the media except for the 2 chair persons
The advisory board used the Analysis Tool: Enabling Blocks Methodology ORGANISATIONAL STRUCTURE AND FACILITATION COSMOS FUNCTIONALITY EQUIPMENT MAINTENANCE, STRUCTURE, DE- PLOYMENT, PROCUREMENT AND CONTRACTS EB 1 EB 2 EB 3 HOUSEKEEPING STRATEGY AND DISCIPLINE EB 4 TRAINING OPERATIONAL STAFFING LEVELS, SHIFT PATTERNS AND PROCEDURES INCENTIVE SCHEMES EB 6 EB 7 EB 5 OPERATIONAL SUPPORT AND FACILITATION OPERATIONAL STRATEGIES Rail INTERFACE EB 10 EB 9 EB 8 OPERATIONAL INFRASTRUCTURE THIRD PARTY EB 12 EB 11 EB = enabling blocks
AGENDA • South Africa’s Experience in 2001 • Lessons learnt in South Africa Where are we now ? • Ports challenge in Kenya
Additional Capacity Existing general cargo berth in Durban was converted to a container handling facility which is now a fully fledged container Terminal Re-configured vessel calls to other ports in South Africa by using ports of PE & Cape Town Operational Infrastructure Purchased 6 cranes (3 Liebherr and 3 Impsa cranes) initially, and later placed an order for 24 cranes Purchased over 225 straddle carriers over a 3 year period Enhanced vessel change over from 4hours to under 2 hours by planning better with marine services Increased rail capacity from 3 trains to 5 train from Gauteng to Durban Systems enhancements COSMOS re-configuration (Planning modules) Introduced SAP Maintenance Module People 65 Sri Lankan trainers were brought in to train & development our Operator skill levels through a best practice programme Introduced a bonus system for operational staff More open license pilots were introduced to cater for increased demand on larger vessel sizes Build a cohesive team for a greater team spirit with intensive and continuous communication strategies Organisational design Reconfigured integrated organisational structure of DCT Workshop structures were revised & shift patterns changed to meet customer demands Commercial Introduced Container Terminal Operations contract (CTOC) which guaranteed berthing on arrival Reward and penalty clause embedded in the contract for higher productivity performances Penalized poor customer behavior in CTOC to ensure compliance to ETA and planning information before vessel arrivals What was actually done in the South African Ports between 2001 to 2007 Initiatives and programmes that were put into place during the period of congestion
Lessons learnt in South Africa • Commitment to resolve issues without assigning blame to any particular supply chain partner, but work in the interest of the country • There must a common platform e.g.. an advisory board or a forum where all shipping lines, port operators, cargo owners etc that can debate and make decisions to help ease the situation. Ideally the forum should be co-chaired to maintain impartiality • To resolve the congestion you will have to work intimately with shipping lines, cargo owners, port, road and rail operators whom you still want to retain as customers • Involve Unions at an early stage • Agreeing a common set of KPI’s is an important milestone to measure all partners in the supply chain • There must be measurements taking place regularly by the advisory board/forum at least every 2 weeks and thereafter monthly once the system sees improvement • South Africa had the benefit of using other ports in the system (Cape Town & Port Elizabeth) which eased the problem in Durban Container terminal • Creating capacity ahead of demand is crucial to maintain a fluid port system
AGENDA • South Africa’s Experience in 2001 • Lessons learnt in South Africa Where are we now ? • Ports challenge in Kenya
186.4 • Monthly volume at DCT increased from 102,000 TEU’s a month in 2001/02 to 180,000 TEU’s a month in 2007/08 • Investment increased from R131m in 2001/02 to R1.9bn in 2007/08 RESULTS FROM THE EFFIECIENCY IMPROVEMENTS AND COLLOBORATIVE WORK • TPT capital investment prior to Transnet’s turnaround strategy • TPT capital investment since Transnet’s turnaround strategy introduced • 1 976 • 1 740 • 2001/02 • 2002/03 • 2003/04 • 2004/05 • 2005/06 • 2006/07 • 2007/08 • DCT throughput prior to turnaround strategy • Monthly TEU’s (Jun 01-Dec 04), ‘000 • DCT throughput after turnaround strategy • Monthly TEU’s (Jun 05-Dec 07), ‘000 Surcharge introduced • Jun 01 • Dec 01 • Jun 02 • Dec 02 • Jun 03 • Dec 03 • Jun 04 • Dec 04 • Jun 05 • Dec 05 • Jun 06 • Dec 06 • Jun 07 • Dec 07 Source: Team analysis
52 TPT PERFORMANCE TREND AT DCT Average vessel productivity distribution Percent • October 2002 • March 2004 • 81% • 72% • <12 • 12-14 • 14-16 • 16-18 • 18-20 • >20 • <12 • 12-14 • 14-16 • 16-18 • 18-20 • >20 • May 2008 • 81% of vessels performed below 16-18 container moves per hour (CGH) in 2002 • In May 2008, 80% of vessels performed above 16 container moves (CGH) • Average performance at DCT for 2007/08 was 22.5 container moves (CGH) • Target for 2008/09 is 25 container moves (CGH) • 80% • <12 • 12-14 • 14-16 • 16-18 • 18-20 • >20 Source: Team analysis
0.15 BREAKDOWN OF TARGET TIMES FOR VESSEL CHANGEOVER Breakdown of vessel changeover duration for different target times Hours • Stevedores • TPT Target: 4 hrs • Vessel • TNPA Finished unlashing to first crane move • 0:05 Stevedores boarding to finished unlashing • 0:50 Target: 3 hrs Gangway ready to stevedores boarding • 0:10 • 0:03 • 0:15 Berth arrival to gangway ready • 0:40 Target: 2 hrs • 0:07 Marine operations (excl. no demand & no space at 109) • 0:13 • 0:00 • 1:25 • 0:25 • 0:05 • 0:10 • 1:10 Requested sailing time to berth departure • 0:15 • 0:50 Finish lashing to requested sailing time • 0:40 • 0:15 • 0:15 • 0:15 • 0:00 Last crane move to finished lashing • 0:20 • 0:17 • 0:15 Source :Vulindela team
620,204 PERFORMANCE AGAINST PLAN: SIGNIFICANT OPERATIONAL EFFICIENCIES ACROSS OPERATING DIVISIONS 2003/04 2005/06 2007/08 Growth in key commodities Key Performance Indicators Rail Total freight (billion vol.km) Net ton km per wagon (GFB) 106 9.9% 105 105 105 103 681,684 100 620,204 2002/03 03/04 04/05 05/06 06/07 2007/08 2003/04 2007/08 Ports Containers (Thousand TEUs) Container moves per crane hour – ContainerTerminals 3,717 Currently 25 3,400 3,010 2,864 2,528 2003/04 04/05 05/06 06/07 2007/08 Durban Cape Town Port Elizabeth Pipe-lines Refined (million Ml/km) Percent capacity utilization 3.4 3.1 2.8 2.8 2.5 Refined Crude Gas 2003/04 04/05 05/06 06/07 2007/08
CORRIDOR APPROACH IS ESSENTIAL FOR SERVING SOUTH AFRICA’S CUSTOMERS Benefits from corridor approach NOC • Transnet as a network business needs to operate in an integrated manner throughout the logistics corridor • Provide a common transformation and long-term planning backbone • Maximise growth opportunities across all operating divisions (rail, port, pipeline) • Capture operational and functional synergies across operating divisions through integrated solutions • Improve efficiency and effectiveness of logistics supply chain • Providing an end-to-end logistics service to customers • Provide optimal capital base for network infrastructure evolution • Focus on key commodities and aligning capital investment to high-growth potential corridors Procure-ment Mainten-ance Functions Yards Projects Sentrarand Yard Kaserne Depot Corridors Newcastle Example Port Danskraal Durban DCT Beit Bridge Messina Louis Trichardt Soekmekaar Ellisras Thabazimbi Pietersburg Drummondlea Vaalwater Chroomvallei Phalaborwa Zebediela Hoedspruit Naboomspruit Middelwit Nylstroom Steelpoort Northam Graskop Marble Hall Roossenekal Rustenburg Plaston Cullinan Komatipoort Witbank Belfast Mafikeng Pretoria Rayton Ogies Machadodorp Krugersdorp Lichtenburg Baberton O/fontein Welgedag Sentrarand Welverdiend Coligny J’burg Hawerklip Breyten B/plaas Vermaas Bethal Lothair Potchestroom Ottosdal Orkney Klerksdorp Wolwehoek Standerton Hotazel Schweizer-Reneke Vierfontein Makwassie Pudimoe Charlestown Ancona Newcastle Vrede Westleigh Erts Golela Utrecht Kroonstad Hlobane Warden Sishen Manganore Naroegas Warrenton Vryheid Arlington Whites Nakop Glen H Palingpan Postmasburg Glencoe Harrismith Virginia Upington Bultfontein Bethlehem Theunisen Ladysmith Kimberley Marquard Kakamas Winburg Bergville Empangeni Nkwalini Douglas Eshowe Bloemfontein Kranskop Richards Bay Moorleigh Ladybrand Sannaspos Koffiefontein Greytown Maseru Belmont Prieska Howick Stanger Hilton Network Copperton Underberg Richmond Donnybrook Mid Ilovo Springfontein Durban Mandonela Matatiele Bethulie Franklin Kelso De Aar Aliwal North Kokstad Harding Simuma Sakrivier Port Shepstone Bitterfontein Dreunberg Barkley East Jamestown Noupoort Maclear Kootjieskolk Calvinia Rosmead Schoombee Hutchinson Hofmeyer Umtata Queenstown Tarkastad Qamata Beaufort West Seymour Klawer Somerset East Amabele Cookhouse Blaney Klipplaat Porterville Fort Beaufort Saldanha East London Prins Alfred Hamlet Touwsrivier Kirkwood Ladysmith Atlantis Calitzdorp Alexandria Worcester Uitenhage Oudtshoorn Patensie Port Alfred George Avontuur Franschhoek Port Elizabeth Riversdale Cape Town Stellenbosch Knysna Mosselbaai Protem Simonstad Strand Bredasdorp
2 SIGNIFICANT INVESTMENT ACROSS ALL DIVISIONS TO REPLACE ASSETS AND CREATE CAPACITY Transnet historic consolidated Capex (excl. SAA) Key projects Investment R bn 2009- 2013 Growth strategy • Cape Town container expansion • Port of Ngqura construction • Ngqura container terminal development including rail link • Durban entrance channel widening 16 NPA Ports 2008 10 TPT 2007 Investing 4 times more than 3 years ago 2006 38 • Coal export /iron ore line expansion • Acquisition of 405 locomotives for GFB, iron ore and the coal line • Maintenance/upgrade of rolling stock and infrastructure TFR Rail 2005 2 TRE 2004 Pipelines 12 • New multi-product pipeline 2003 2002 Specialist Units 2 • Business intelligence and building upgrades 2001 80 Total investment =2009-2013
AGENDA • South Africa’s Experience in 2001 • Lessons learnt in South Africa Where are we now ? • Ports challenge in Kenya
456 000 The Kenya Ports Challenge • 22% increase in container traffic from 479355 teus (2006) to 585367 teus (2007) • There has been no injection of terminal capacity • Automatation of the cargo handling system • Users resisting due to redundancy or potential retrenchment • Dwell time is high as shippers not collecting their cargo in time • Rail service needs improvement • Considering increasing of speed of loco’s • Investing in new gauge rail lines • Lack of space within the Port area • Plans to acquire new land from the industrial commercial & development corporation have failed • Dwell time might be high • All the above will lead to vessels delays which will cause an increase in freight costs for the end user 3 year container volume for Kenya +16% +22% 585 367 479 355 Container traffic In TEU’s 436 671 2005 2006 2007 Source : Containerization yearbook, 2008
850 Vessels expected between 23rd Sept 2008 – 4th Oct 2008 Container exchange volumes 0 200 400 600 800 1 000 1 200 ARNIS TRAVE TRADER DESPINA P FLORA DELMAS PROVIDENCE HELVETIA KOTA ANGGUN • Dwell time of boxes in stack • Collecting of cleared cargo • Moving containers to ICD’s/Bonded warehouse • Bulk runs at night and off peak periods MSC SIERRA MSC NORMANDIE SAFMARINE CONCORDE H&H WAVE TERRA LUMINA SAFMARINE BANDAMA 1 050 MSC HIMALAYA 1 100 SAFMARINE EUROPE MSC EMILIA S MOL ULTIMATE = 5335 containers to be discharged and loaded on the 4 October 2008 SAFMARINE BIA 1 200 LISSY SCHULTE 1 140 Discharge Load Source : Business daily, Wednesday 24, 2008, page 17
Establish a forum or an advisory board where issues can be discussed with all supply chain partners • Create an agreed set of KPI’s • Measure bi-weekly all the agreed KPI’s • Use an independent operations audit team if necessary 1 • Choose the high impact problems to be resolved first • Agree with port users on the problem to be resolved and that there will be pain during this time (reducing the dwell time of cargo in the port) • Bring in additional experienced resources to help if necessary • Collaboration with other ports in the region whilst KPA fixes the problem 2 • Communication internally and externally • Keep customers and port users informed and involve them to be a part of the solution • Assign one talking head as the ports reputation can be at stake – Consider a media black-out period • Keep government and customers informed of progress 3 Some recommendations