Download
1 / 1
10 likes | 94 Vues
A high-throughput, high-resolution spectrometer for mapping the heliopause and 3-D Solar Wind using He+ 30.4nm. M.Lampton 1 , J.Edelstein 1 , T.Miller 2 , and M.Gruntman 3.

E N D
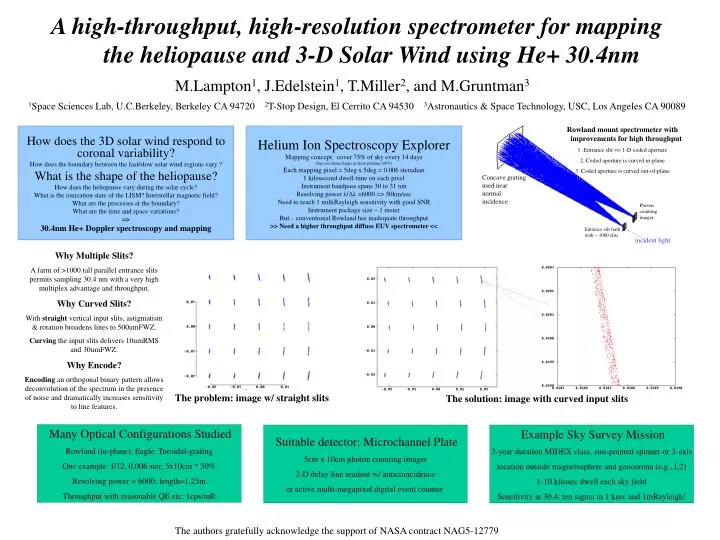
A high-throughput, high-resolution spectrometer for mapping the heliopause and 3-D Solar Wind using He+ 30.4nm M.Lampton1, J.Edelstein1, T.Miller2, and M.Gruntman3 1Space Sciences Lab, U.C.Berkeley, Berkeley CA 94720 2T-Stop Design, El Cerrito CA 94530 3Astronautics & Space Technology, USC, Los Angeles CA 90089 Rowland mount spectrometer with improvements for high throughput 1. Entrance slit => 1-D coded aperture 2. Coded aperture is curved in-plane 3. Coded aperture is curved out-of-plane How does the 3D solar wind respond to coronal variability? How does the boundary between the fast/slow solar wind regions vary ? What is the shape of the heliopause? How does the heliopause vary during the solar cycle? What is the ionization state of the LISM? Interstellar magnetic field? What are the processes at the boundary? What are the time and space variations? => 30.4nm He+ Doppler spectroscopy and mapping Helium Ion Spectroscopy Explorer Mapping concept: cover 75% of sky every 14 days (Sun avoidance keeps us from pushing 100%) Each mapping pixel = 5deg x 5deg = 0.006 steradian 1 kilosecond dwell time on each pixel Instrument bandpass spans 30 to 31 nm Resolving power λ/Δλ=6000 => 50km/sec Need to reach 1 milliRayleigh sensitivity with good SNR Instrument package size ~ 1 meter But... conventional Rowland has inadequate throughput >> Need a higher throughput diffuse EUV spectrometer << Concave grating used near normal incidence Photon counting imager Entrance slit farm with ~ 1000 slits incident light Why Multiple Slits? A farm of >1000 tall parallel entrance slits permits sampling 30.4 nm with a very high multiplex advantage and throughput. Why Curved Slits? With straight vertical input slits, astigmatism & rotation broadens lines to 500umFWZ. Curving the input slits delivers 10umRMS and 30umFWZ. Why Encode? Encoding an orthogonal binary pattern allows deconvolution of the spectrum in the presence of noise and dramatically increases sensitivity to line features. The problem: image w/ straight slits The solution: image with curved input slits Many Optical Configurations Studied Rowland (in-plane); Eagle; Toroidal-grating One example: f/12, 0.006 ster, 5x10cm * 50% Resolving power = 6000; length=1.25m Throughput with reasonable QE etc: 1cps/mR Suitable detector: Microchannel Plate 5cm x 10cm photon counting imager 2-D delay line readout w/ anticoincidence or active multi-megapixel digital event counter Example Sky Survey Mission 3-year duration MIDEX class, sun-pointed spinner or 3-axis location outside magnetosphere and geocorona (e.g., L2) 1-10 kilosec dwell each sky field Sensitivity at 30.4: ten sigma in 1 ksec and 1mRayleigh! The authors gratefully acknowledge the support of NASA contract NAG5-12779