Download
1 / 23
240 likes | 486 Vues
SENAMHI – Perú Curso de Climatología Sinóptica en la Costa Oeste de América del Sur 16-20 Abril 2007; Lima - Perú. Relator: Dr. René D. Garreaud www.dgf.uchile.cl/rene Departamento de Geofísica Universidad de Chile. Presentación No. 1: Climatología de Sud América

E N D
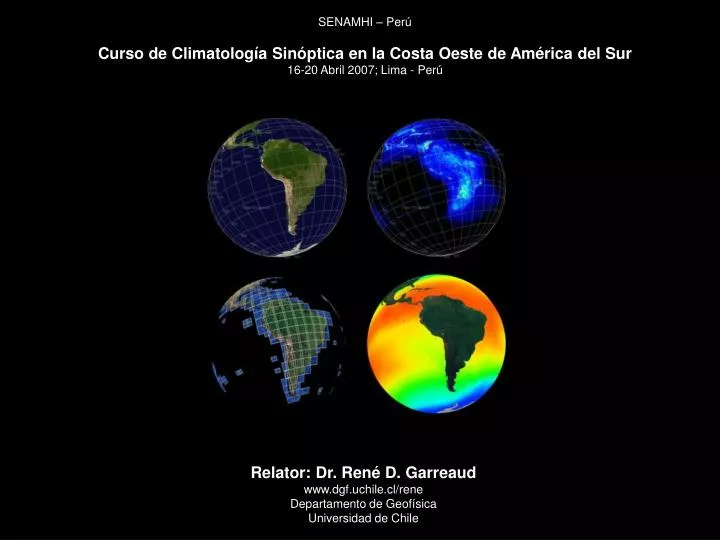
SENAMHI – Perú Curso de Climatología Sinóptica en la Costa Oeste de América del Sur 16-20 Abril 2007; Lima - Perú Relator: Dr. René D. Garreaud www.dgf.uchile.cl/rene Departamento de Geofísica Universidad de Chile
Presentación No. 1: Climatología de Sud América • En esta exposición se describe el clima actual de Sud América empleando observaciones instrumentales durante el siglo XX. La exposición comienza con una descripción de las bases de datos disponibles para efectuar tal climatología. Luego, se provee un entendimiento básico de los procesos físicos que explican la distribución promedio y el ciclo anual medio de las variables meteorológicas (precipitación, temperatura, vientos) sobre el continente Sud Americano y los océanos adyacentes. También se describen en forma sucinta los patrones continentales de variabilidad climática asociados con ENSO, PDO y AAO. • Fuentes de datos para estudios de climatología • Circulación global y contexto geografico • Patrones de circulación continental • Variabilidad interanual • Efectos de ENOS, PDO, AAO
DATA SOURCES AND PRODUCTS Gridded Analysis Surface and Upper Air Observations Gridding method Assimilation system Satellite Products
Table 1. Main features of datasets commonly used in climate studies
Surface (land/ocean) Synoptic Stations Met. Observations (T,Td,P,V,…) @ 0, 6, 12, 18 UTC are transmitted in real-time to WMO and Analysis Centers
Red de Radiosondas (OMM, GTS) Perfiles verticales (20 km) de T, HR, viento, presión, cada 12 / 24 hr
Observaciones en altura IV: Info. Obtenida por Aviones comerciales Perfiles verticales (0-10 km) de T, HR, viento, presión, y datos a nivel (10 km) a distintas horas. También se transmiten via GTS
Global Historical Climate Network (GHCN) Mean Temperature Precipitation All stations (anytime, any length) Century-long stations (Ti<1905, Tf>1995, missdata<20%)
Reanalysis?! Because analysis are produced in real-time, some data is not assimilated, but it was archived. In the 90’s the NCEP-NCAR (USA) began a major project in which they re-run their assimilation system with all the available data. The result is the widely used “Reanalysis” data, including many fields (air temperature, wind, pressure) on a regular 2.5°x2.5° lat-lon grid, from 1948 to present every 6 hours (also available daily, monthly and long-term-mean means). Fields are 2- or 3-Dimensional. Preferred data format: NetCDF. Freely available.
Reanalysis Reanalysis system also includes a meteorological model from which precipitation and other not-observed variables (e.g., vertical motion) are derived. Reanalysis data is great for studying interannual and higher frequency variability. Interdecadal variability and trends are not so well depicted (we don’t trust much before the 70’s, particularly in the SH). European Center (ECMWF) did a similar effort (ERA-15 and ERA-40). Higher horizontal resolution (1.25°x1.25°), but harder to get.
Jan Jun Example of some daily fields from NNR Climatology of 300 hPa winds (10-12 km) from NNR
Geographical setting Guinas highlands 10°N Llanos 0°N Equatorial Andes Amazon basin Brazilian highlands 20°S Altiplano Chaco Subtropical Andes La Plata basin 40°S Pampas Patagonia 60°S
Because of its long meridional extent, South America exhibits tropical, subtropical and extratropical climatic regimes
1 1 2 8 9 3 4 5 10 6 7 1 1 2 9 2 8 5 11 7 3 3 11 6 10 4 4 Precipitation features 1. ITCZ 2. Continental convection 3. Altiplano convection 4. SACZ 5. Pampas convection 6. Midlatitude storm track 7. Orographic precipitation 8. Coastal desert 9. NE Brazil semiarid 10. Patagonia dry zone 11. Ocean desert Circulation features 1. ITCZ 2. Trade winds 3. Subtropical high 4. Midlatitude westerlies 5. Low level jet 6. SACZ 7. Bolivian high 8. NE Brazil trough 9. Tropical easterlies 10. Midlatitude westerlies 11. Jet stream
Another Perspective of the Precipitation Field Annual Mean / Zonal Mean Annual Mean / Zonal asymmetry January - July Mean
Convective rainfall also exhibits a pronounced diurnal cycle
The Precipitation Variability (UdW data) Which regions exhibit large year-to-year variability?
Stronger than normal westerlies leads to rainy conditions over western Patagonia BUT drier conditions over eastern Patagonia (orographic effects)…not much elsewhere….
Annual mean Precip/SAT regressed upon index of large-scale modes (50 years of data)
Seasonal correlation between Precip/SAT and Multivariate ENSO Index (50 years of data)