Download
1 / 21
220 likes | 336 Vues
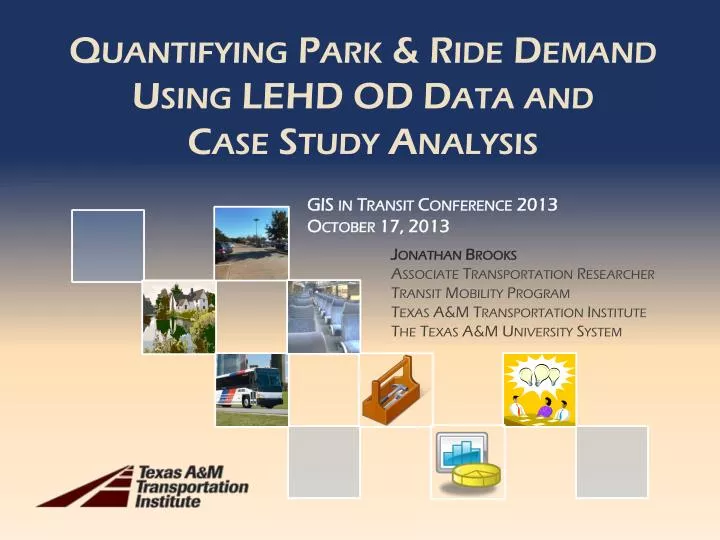
Quantifying Park & Ride Demand Using LEHD OD Data and Case Study Analysis. GIS in Transit Conference 2013 October 17, 2013. Jonathan Brooks Associate Transportation Researcher Transit Mobility Program Texas A&M Transportation Institute The Texas A&M University System. The Question.

E N D
Quantifying Park & Ride Demand Using LEHD OD Data and Case Study Analysis GIS in Transit Conference 2013 October 17, 2013 Jonathan Brooks Associate Transportation Researcher Transit Mobility Program Texas A&M Transportation Institute The Texas A&M University System
The Question Houston CBD New ? FBC Park & Ride
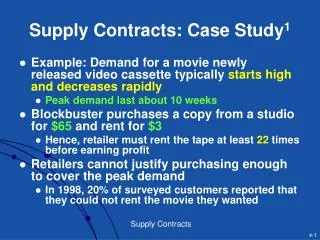
Park & Ride Market-Sheds • Limited by distance • Facilities close together may reduce each other’s ridership generation • Rider’ willingness to backtrack limited • Market-shed most often parabolic shape • 50% of riders typically live within 2.5 miles
Source: Final Report, New York City Park & Ride Study, January 2012
Source: Park-and-Ride Planning and Design Guidelines, Spillar (1997)
Demand Estimation ModelSimplified Steps • Identify case study sites, obtain ridership data • Obtain OD worker flow volumes from LEHD • Calculate mode capture rates • Apply capture rates to potential new sites
Location of Case Study Facilities Houston Metro P&Rs: Spring Kingwood Townsen Bay Area Grand Parkway Kingsland Cypress Northwest Station 28 mi 21 mi 27 mi 21 mi 20 mi 27 mi FBC Transit P&Rs: AMC Movie Theater University of Houston CBD 25 mi 5 miles 22 mi 10 miles 24 mi 24 mi 20 miles
Observations about METRO Sites • 2.5 mi radius circle covered about 37% of riders (2009 & 2012 license plate data) • Parabola can describe general distribution • Findings generally coincided with literature
Summary of Case Study • Average distance to CBD: 24.3 miles • Average peak weekday CBD bound riders: 726 • Average # of inbound bus trips: 25 • Typical headway in peak of peak: 3 minutes
Longitudinal Employer-Household Dynamics (LEHD), US Census • Annual data • Links home to work Census Blocks • Work data, not exactly travel data • OnTheMap is the online tool
Paired Analysis for OD Flows • Selected 2.5 mile radius around P&R • Selected 1 mile radius to encompass CBD • Tabulated OD volume between two sites, by income bracket • $1,250 per month or less • $1,251 to $3,333 per month • More than $3,333 per month
Step 1. Select Analysis Sites 2.5 mile radius circle around facility used to identify home Census Blocks 1 mile radius circle around CBD used to identify work Census Block
Case Study Findings Based on analysis of the 2.5 mile radius around case study METRO park & rides: • Average weekday CBD bound riders: 767 • Average LEHD worker flow to CBD: 1,579 • Park & ride modal capture ratio: 18% • Lowest three sites 11% • Highest three sites 28%
Potential New Park & Ride Current FBC Facilities: AMC Movie Theater University of Houston CBD 5 miles 22 mi 10 miles 24 mi 20 miles
Questions? Jonathan Brooks J-brooks@ttimail.tamu.edu