Download
1 / 1
10 likes | 120 Vues
P176: A Quantitative Risk Assessment Model for Salmonella and Whole Chickens at Retail Thomas P. Oscar , Agricultural Research Service, USDA, 1124 Trigg Hall, University of Maryland Eastern Shore, Princess Anne, MD 21853 410-651-6062; 410-651-6568 (fax); toscar@umes.edu. INTRODUCTION

E N D
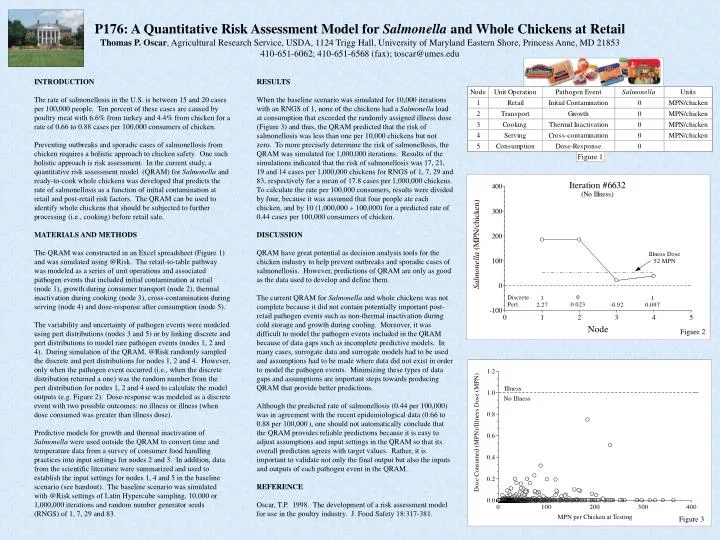
P176: A Quantitative Risk Assessment Model for Salmonella and Whole Chickens at Retail Thomas P. Oscar, Agricultural Research Service, USDA, 1124 Trigg Hall, University of Maryland Eastern Shore, Princess Anne, MD 21853 410-651-6062; 410-651-6568 (fax); toscar@umes.edu INTRODUCTION The rate of salmonellosis in the U.S. is between 15 and 20 cases per 100,000 people. Ten percent of these cases are caused by poultry meat with 6.6% from turkey and 4.4% from chicken for a rate of 0.66 to 0.88 cases per 100,000 consumers of chicken. Preventing outbreaks and sporadic cases of salmonellosis from chicken requires a holistic approach to chicken safety. One such holistic approach is risk assessment. In the current study, a quantitative risk assessment model (QRAM) for Salmonella and ready-to-cook whole chickens was developed that predicts the rate of salmonellosis as a function of initial contamination at retail and post-retail risk factors. The QRAM can be used to identify whole chickens that should be subjected to further processing (i.e., cooking) before retail sale. MATERIALS AND METHODS The QRAM was constructed in an Excel spreadsheet (Figure 1) and was simulated using @Risk. The retail-to-table pathway was modeled as a series of unit operations and associated pathogen events that included initial contamination at retail (node 1), growth during consumer transport (node 2), thermal inactivation during cooking (node 3), cross-contamination during serving (node 4) and dose-response after consumption (node 5). The variability and uncertainty of pathogen events were modeled using pert distributions (nodes 3 and 5) or by linking discrete and pert distributions to model rare pathogen events (nodes 1, 2 and 4). During simulation of the QRAM, @Risk randomly sampled the discrete and pert distributions for nodes 1, 2 and 4. However, only when the pathogen event occurred (i.e., when the discrete distribution returned a one) was the random number from the pert distribution for nodes 1, 2 and 4 used to calculate the model outputs (e.g. Figure 2). Dose-response was modeled as a discrete event with two possible outcomes: no illness or illness (when dose consumed was greater than illness dose). Predictive models for growth and thermal inactivation of Salmonella were used outside the QRAM to convert time and temperature data from a survey of consumer food handling practices into input settings for nodes 2 and 3. In addition, data from the scientific literature were summarized and used to establish the input settings for nodes 1, 4 and 5 in the baseline scenario (see handout). The baseline scenario was simulated with @Risk settings of Latin Hypercube sampling, 10,000 or 1,000,000 iterations and random number generator seeds (RNGS) of 1, 7, 29 and 83. RESULTS When the baseline scenario was simulated for 10,000 iterations with an RNGS of 1, none of the chickens had a Salmonella load at consumption that exceeded the randomly assigned illness dose (Figure 3) and thus, the QRAM predicted that the risk of salmonellosis was less than one per 10,000 chickens but not zero. To more precisely determine the risk of salmonellosis, the QRAM was simulated for 1,000,000 iterations. Results of the simulations indicated that the risk of salmonellosis was 17, 21, 19 and 14 cases per 1,000,000 chickens for RNGS of 1, 7, 29 and 83, respectively for a mean of 17.8 cases per 1,000,000 chickens. To calculate the rate per 100,000 consumers, results were divided by four, because it was assumed that four people ate each chicken, and by 10 (1,000,000 100,000) for a predicted rate of 0.44 cases per 100,000 consumers of chicken. DISCUSSION QRAM have great potential as decision analysis tools for the chicken industry to help prevent outbreaks and sporadic cases of salmonellosis. However, predictions of QRAM are only as good as the data used to develop and define them. The current QRAM for Salmonella and whole chickens was not complete because it did not contain potentially important post-retail pathogen events such as non-thermal inactivation during cold storage and growth during cooling. Moreover, it was difficult to model the pathogen events included in the QRAM because of data gaps such as incomplete predictive models. In many cases, surrogate data and surrogate models had to be used and assumptions had to be made where data did not exist in order to model the pathogen events. Minimizing these types of data gaps and assumptions are important steps towards producing QRAM that provide better predictions. Although the predicted rate of salmonellosis (0.44 per 100,000) was in agreement with the recent epidemiological data (0.66 to 0.88 per 100,000), one should not automatically conclude that the QRAM provides reliable predictions because it is easy to adjust assumptions and input settings in the QRAM so that its overall prediction agrees with target values. Rather, it is important to validate not only the final output but also the inputs and outputs of each pathogen event in the QRAM. REFERENCE Oscar, T.P. 1998. The development of a risk assessment model for use in the poultry industry. J. Food Safety 18:317-381. Figure 1 Figure 2 Figure 3