Download
1 / 20
200 likes | 317 Vues
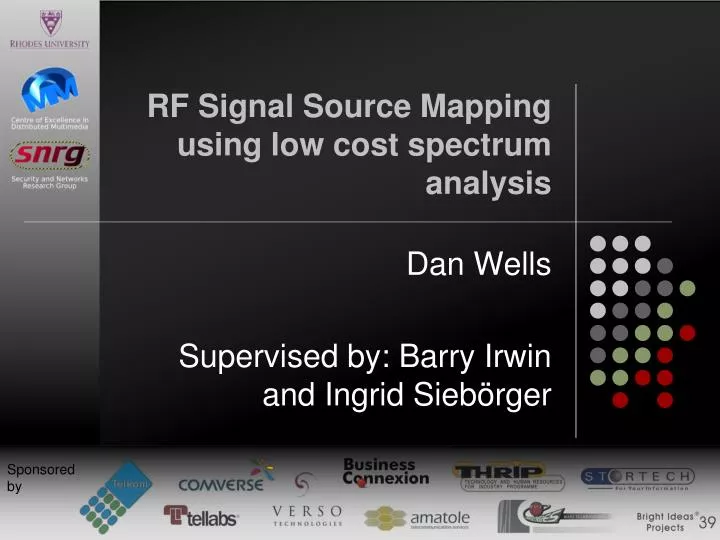
RF Signal Source Mapping using low cost spectrum analysis. Dan Wells Supervised by: Barry Irwin and Ingrid Siebörger. Outline of presentation. Problem Statement Project outline and goals WiSpy SSM Tool (three parts) Screenshots in action Conclusions Future work. Problem Statement.

E N D
RF Signal Source Mapping using low cost spectrum analysis Dan Wells Supervised by: Barry Irwin and Ingrid Siebörger
Outline of presentation • Problem Statement • Project outline and goals • WiSpy SSM Tool (three parts) • Screenshots in action • Conclusions • Future work
Problem Statement 802.11a > Not common (and 5 GHz) 802.11b/g > Popular 802.11n > New and improved 802.11b/g/n all use 2.4 GHz range Frequency is becoming cluttered Need to use optimal channel, minimise interference and discover rogue AP’s and remove
Project Outline and Goals Using three (minimum) synchronised spectrum analysers can we trilaterate a RF signal in the range (2400-2483MHz) ? Produce a tool in MS Visual C# to collect frequency VS amplitude data and process it Display signal data meaningfully Evaluate the tool for accuracy
WiSpy SSM Collector • Interfaces with the MetaGeek WiSpy through a USB Human Interface Device (HID) API • Collects chunks of signal data • Passed directly to webservice • Or, stored locally and transmitted later • Passes node name, associated time and location with the signal data • Location -> Updated dynamically via GPS
Screenshots of WiSpy SSM Collector [1/2] 802.11b 802.11g 802.11n
ASP.NET Webservice Interface to SQLite Database Request and Response SOAP/XML Stateless MD5 hash checking database initialisation protection Deployed to Microsoft IIS
WiSpy SSM Compiler Send requests to the webservice for specific time ranges of data for selected collecting nodes Signal data is sorted (sync’d to time), displayed, played and replayed to user All data can be saved to file via XML serialization and reloaded offline
Evaluation Setup • One access point • D-Link DWL-2100 802.11b • One wireless desktop client • Regular traffic • Three collecting nodes (two fixed, one mobile)
Conclusion • Goals achieved • Graphically display signal strength at each node meaningfully • Fairly accurate • Tool produced • WiSpy SSM Collector (2238 lines) • WiSpy SSM Compiler (1590 lines) • Webservice (354 lines)
Future Projects Integrate a spectrum analyser with higher resolution and more functionality (WiSpy 2.4x, Cognio Spectrum Expert?) Test with more WiSpy devices