Download
1 / 21
270 likes | 584 Vues
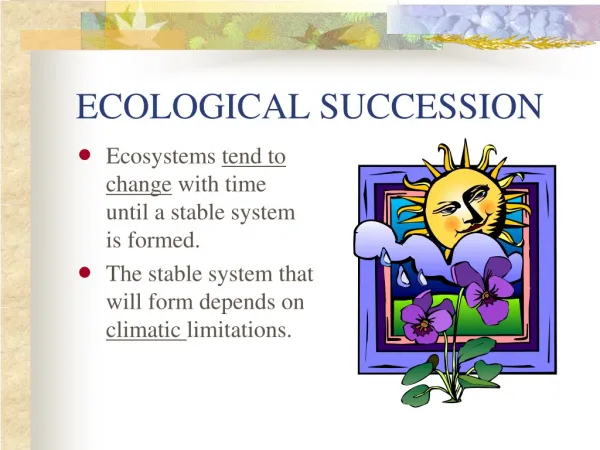
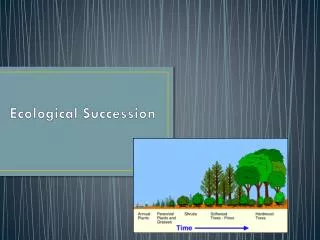
Patterns in time. Ecological succession. Frederic E. Clements 1874-1945. Henry A. Gleason 1882-1975. Plant succession is the directional development of the vegetation of a given homogeneous area over a period of time towards a single climax structure (Clements 1916).

E N D
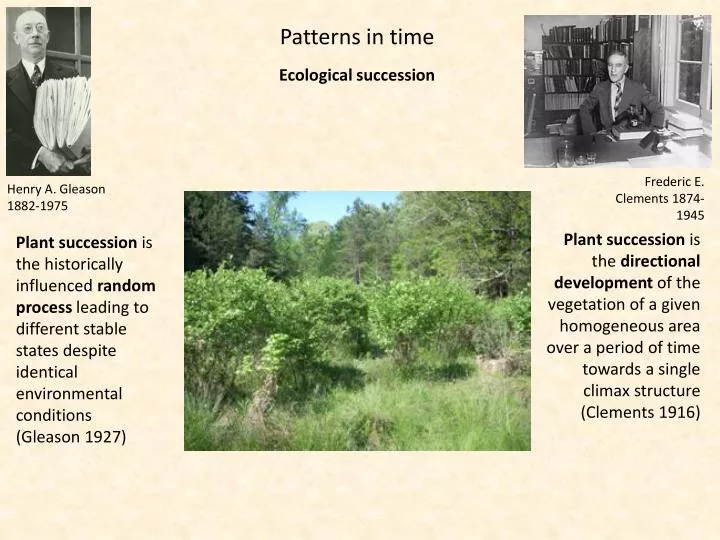
Patterns in time Ecological succession Frederic E. Clements 1874-1945 Henry A. Gleason 1882-1975 Plant succession is the directional development of the vegetation of a given homogeneous area over a period of time towards a single climax structure (Clements 1916) Plant succession is the historically influenced random process leading to different stable states despite identical environmental conditions (Gleason 1927)
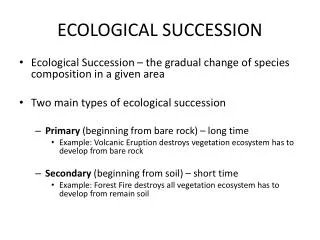
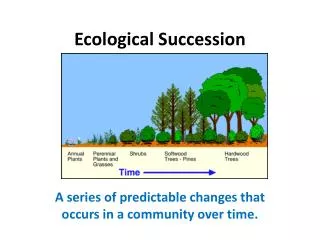
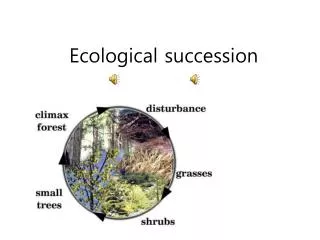
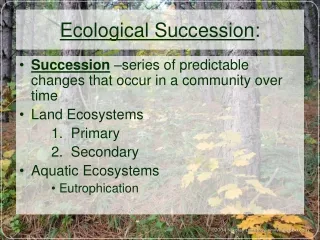
Primary Successional stages Bare soil of rocks Succession is not a deterministic process. The successional sequence might end in different final stable states Annual and biannual plants Soils crusts, Cyanobacteria, Lichen, Mosses Pioneer species Shrubs, trees In manytemperaturesuccessioalseriesforests form the climaxcommunity Climax community
Soilcrusts Cyanobacteria, mosses, lichen Soilmosses and lichen Crusts are well adapted to severe growing conditions, drought and waterloss. Crusts generally cover all soil spaces not occupied by vascular plants, and may be 70% or more of the living cover Cyanobacteria Soilcrustsstabilizesoils and increasewaterretention.
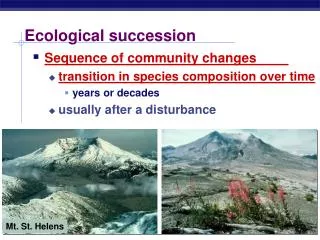
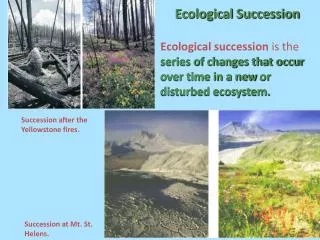
Secondary succession Secondary succession is the change in faunal or floral composition after severe disturbance Major disturbances are Fire Storm Flooding Lava flows Secondary succession starts mainly from seed banks. Colonization is often of minor importance. Seeds remain healthy for some months to more than 1000 years. In cyclic succession (frequent fires)seed banks allow for fast recover.
Adaptive strategies Modified from Brown, Southwood 1987 Plants, herbivorous insects Generation time Reproductive effort Plants, aphids Plants, birds, some insects Niche breadth Morphological diversity Herbivorous insects Bees, wasps Flight ability Diversity Plants, insects Woodlands Young field Midfield Successional stage Different successional stages filter for different life history strategies (habitat filtering)
The r – K – A triangle Habitat templates (Southwood and Greenslade)
Communitypatternsduringsuccession Annuals and biannuals Annuals and biannuals Shrubs Speciesrichness Shrubs Abundance Trees Trees Time Time Speciesrichness, totalabundance, and totalbiomassgenerallypeakatintermediatestages of succession. Biomass Time
Succession of beta diversity Brown, Southwood 1987
Intermediate disturbance Competitiion New Zealand stream invertebrates (Townsend 1997) Extinction Immigration Number of niches
The Markov chain approach to succession Henry S. Horn 1941- Abundances Columnstochastic transition probability matrix Stable state (eigen)vector
Bertness, Leonhard, Ecology 78: 1976-1989 Positiveinteractions Joint defences Habitat amelioration Frequency of competitiveinteractions Frequency of positiveinteraction Increasingphysicalstress Increasingconsumerpressure The stress gradient hypothesispredictsincreasedproportions of positive (mutualistic) interactions in plant communitiesatintermediatelevels of stress and herbivorepressure.
3 3 3 2 2 2 1 1 1 0 0 0 -1 -1 -1 -2 -2 -2 Oulu Vaasa Central Finland -3 -3 -3 1964 1968 1972 1976 1980 1964 1968 1972 1976 1980 1964 1968 1972 1976 1980 3 3 3 2 2 2 1 1 1 0 0 0 -1 -1 -1 -2 -2 -2 Häme Uusimaa Turku-Pori -3 -3 -3 1964 1968 1972 1976 1980 1964 1968 1972 1976 1980 1964 1968 1972 1976 1980 3 3 3 2 2 2 1 1 1 0 0 0 -1 -1 -1 -2 -2 -2 Lapland Kuopio North Karelia -3 -3 -3 1964 1968 1972 1976 1980 1964 1968 1972 1976 1980 1964 1968 1972 1976 1980 3 3 2 2 1 1 0 0 -1 -1 -2 -2 Mikkeli Kymi -3 -3 1964 1968 1972 1976 1980 1964 1968 1972 1976 1980 Linkedpatterns in time Population dynamics (1964 to 1983) of the red squirrel in 11 provinces of Finland (Ranta et al. 1997) Patrick A.P. Moran (1917-1988) The Moran effect Regionalsychronization of localabundancesdue to correlatedenvironmentaleffects
20 30 40 50 60 70 80 90 Defoliation by gypsy moths in New England states 700000 Maine 600000 500000 Acres Defoliated 400000 300000 200000 100000 0 2500000 New Hampshire 2000000 1500000 Acres Defoliated 1000000 500000 0 140000 120000 Vermont Lymantria dispar 100000 80000 Acres Defoliated 60000 40000 20000 0 3000000 Massachusetts Gradation: The massive increase in density 2500000 2000000 Acres Defoliated 1500000 1000000 500000 0 Year Data from Williams and Liebhold (1995)
Taylor’s power law Assume an assemblage of species, which have different mean abundances and fluctuate at random but proportional to their abundance. Going Excel The relationship between variance and mean follows a power function of the form Taylor’s power law; proportional rescaling
Ecological implications Temporal variability is a random walk in time Abundances are not regulated Extinctions are frequent Temporal species turnover is high Temporal variability is intermediate Abundances are or are not regulated Extinctions are less frequent Temporal species turnover is low Temporal variability is low Abundances are often regulated Extinctions are rare Temporal species turnover is very low
Evolutionarytimescales Nicheconservatismrefers to the tendency of closelyrelatedspecies to havesimilarnicherequirements. The requirementstranslateintosimilarecological, morphologicalorbehaviouraltraitsmediated by genomicsimilarities. 100% Body size Female body length Sex dimorphism How much variance in importantnichedimensions of Europeanplantsisexplained by taxonomcrelatedness? Male body length Dietaryrange Colours Migratorybehaviour 50% Shadingpreference Abundance Moisturepreference German rangesize Shadingtolerance Habitat tolerance Moisturetolerance Europeanrangesize 0% Spiders Birds Entling et al. 2007, Gl. Ecol. Biogeogr. 16: 440-448 Prinzing et al. 2001. Proc. R. Soc. B 268: 1.
1 0.8 0.6 Fraction of singletons 0.4 0.2 0 1 10 100 1000 10000 Number of species 1 0.8 0.6 Fraction of abundant species 0.4 0.2 0 1 10 100 1000 10000 Number of species Taxon species richness and local abundances The case of Hymenoptera Continental taxon species richness of Hymenoptera is correlated to mean local abundances Species rich hymenopteran taxa contain more locally rare and fewer locally abundant species 5 4 3 Mean density per species 2 1 0 1 10 100 1000 10000 Number of species
Numbers of families and species scale allometrically to floral species richness 60 • Species richer sites contain relatively less higher taxa. • Species richer sites have higher species per genus (S/G) ratios • Species richer sites contain higher proportions of ecologically similar species(environmental filtering) 50 40 Number of genera 30 20 0.77 y = 1.78x 10 2 R = 0.94 0 0 20 40 60 80 Number of species in a flora 35 Darwin’scompetitionhypothesis: Closelyrelatedspeciesshould be ecologicallymoresimilar and underhigherselectionpressurethanmoredistantlyrelatedspecies 30 25 20 Number of families 15 10 0.61 y = 1.9x 5 2 R = 0.70 0 0 20 40 60 80 Number of species in a flora Enquist et al. 2002. Nature 419: 610-613
Earlysuccession Regionalpool of species Regionalpool of species Facilitation Regionalpool of potentialcolonizers Environmentalfilters Randomcolonization Phylogeneticsegregation Phylogeneticclumping No phylogeneticstructure No phylogeneticstructure Localcolonizers Latersuccession Competition Positiveinteractions Neutralinteractions Phylogeneticsegregation No phylogeneticstructure Phylogeneticclumping Localcommunitystructure Zaplata et al. 2013