Download
1 / 49
1.2k likes | 1.95k Vues
Building Business Acumen. Building Business Acumen. Pop Quiz. How much cash was on hand? What were the total Revenues (Sales)? What was the Net Profit? What was the Net Profit Margin? What was EBITDA? What was the Revenue per Employee? How much did Revenues grow year over year?

E N D
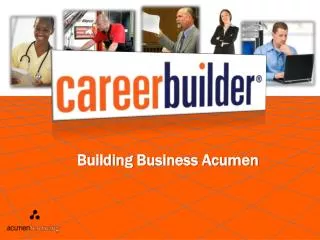
Building Business Acumen Building Business Acumen
Pop Quiz • How much cash was on hand? • What were the total Revenues (Sales)? • What was the Net Profit? • What was the Net Profit Margin? • What was EBITDA? • What was the Revenue per Employee? • How much did Revenues grow year over year? • How much did Net Profit grow year over year? • How much did EBITDA grow year over year? • How many Expressions of Interest (EOI)? • What was the Net Promoter Score (NPS)? 35
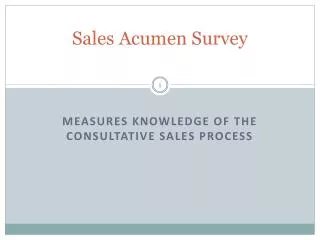
Objectives • List and describe 11 key performance measures that are important to the Executive Team. • List and describe the five business drivers all successful businesses must focus on. • Create a personal action plan that can positively impact personal performance and company results. • Betterarticulate company performance & strategy.
What is Business Acumen? …the ability to make good business decisions in a timely manner with an understanding of how the decision should impact the business. 3
Wayne Gretzky …referred to as the “The Great One” When asked by a reporter… “What makes you so Great?!” Wayne responded by saying… “I don’t skate to where the puck is, I skate to where the puck is going to be.” Hockey Acumen
Business is Tough! • Only 5-10% of business start-ups survive past 5 years. • 14% of CEOs lose their job every year. • Booz & Co. • 70% of merger and acquisition activity do not live • up to expectation. Wall Street Journal 2007 5
Business Acumen • Every business must focus on fivebusinessdrivers. • If they do, they will be successful. • If they don’t, they’ll fail. 4
Build a Business • Inherited business from long lost relative. • Located in on busy street corner of the city. • 1000 passer-by’s of which 500 are buyers. • Motivation is to be successful in one year to inherit relative’s massive fortunes. 5
Defining CASH Definition What is required to grow and maintain the business. Measures Cash – the bills and coins in the register, petty cash, and cash in the bank. Also includes cash equivalents, like CD’s and other highly liquid investments, that easily convert into cash within 90 days. Cash Flow – The cash generation from core business activities calculated from the difference between the cash that flows into and out of the business in a given period of time (month, quarter, annual) 8
How to Obtain Cash ProCon • Earn it • Sell Assets • Borrow it No Cost Immediate Immediate Time Reduce Assets Cost (Interest) Can a company have too much Cash? How much is too much/little? 9
How Much Cash? • A company should have sufficient cash to cover… • their interest • expenses • capital expenditures • plus a little for emergencies • ~ Investopedia Top Uses of Cash for Corporations • Dividend Pay-outs • Stock Buy-backs • Mergers & Acquisitions (M&A) • Research & Development (R&D) • Capital Expenditures (CAPEX) • Cash Balance Increase 9
Benchmark Cash 24% 9% 5% 18% 33%
CASH Review • Define Cash Driver • What is required to grow and maintain the business. 2. Measures of Cash 1. Cash – easily converted in 90 days or less to cash. 2. Cash Flow – Difference of cash in and cash out over a given period of time. 3. Importance of Cash Driver - Sufficient to run business - Enhance shareholder value - Improve attractiveness to suppliers and customers. • Benchmark the numbers • 200820092010 • Revenue $762 M $565 M $584M • Cash $34 M $49 M $140 M 9
Large Group Discussion What can you do to positively impact focusing on Cash and/or Cash Flow. Possibilities • Increase Sales • Reduce Costs • Improve new product launch schedules • Reduce travel • Better manage Account Receivables • Reduce/conserve operating costs • Delay purchases • Improve Project Planning • Improve Data Input • Better Manage Account Payables 9
Defining PROFIT Definition What is left over after you have subtracted expenses. Can be expressed in dollars ($) or percent (%). Measures Gross Profit / Gross Profit Margin – Profit after Cost of Goods Sold (COGS) have been subtracted from sales. Earnings Before Interest Tax Depreciation & Amortization (EBITDA) – Reflects controllable earnings. Net Profit / Net Profit Margin – Profit after all expenses have been subtracted from sales. 10
Sale Price: $1.00 Water - $ .04 Label - $ .10COGS Bottle & cap - $ .11 Packaging (Direct Labor) - $ .15 Total: ($ .40) $1.00 - $.40 = $.60 = 60% Gross Profit Rent - $ .03 Salaries, Gen, Admin. - $ .10 Marketing - $ .07 Shipping - $ .15 Total: ($.35) $1.00 - $.40 - $.35 = $.25 = 25% EBITDA Depreciation / Amorit. - $.02 Interest & Tax - $.12 Total: ($.14) $1.00- $.40 - $.35 - $.14 = $ .11 = 11% Net Profit Life Spring Artesian Water
High Profit Companies 32% 28% 22%
Low Profit Companies 8.0% 3.6% 1.7%
Profit in Action United Parcel Services (UPS) – Avoiding left-hand turns • 92,000 trucks worldwide • Saved over 28,541,472 miles • Saved 3 million gallons of fuel • Reduced insurance premiums • Reduced maintenance frequency • and costs
PROFIT Review • Define Profit Driver • What is left over after you have subtracted expenses. Can be expressed in dollars ($) or percent (%). 2. Measures of Profit 1. EBITDA (Margin) – subtract COGS & SG&A 2. Net Profit (Margin) – subtract all expenses 3. Importance of Profit Driver - Net Profit is one of the most important #’s for the business. - Indicates price strength - Identifies ability to manage costs • Benchmark the numbers • 200820092010 • EBITDA $39 M $70 M $80 M • Net Profit 1.5% 9.0% 11.4% 11
Small Group Discussion Discuss an action item You are committed to take immediate steps to positively impact focusing on Profit. Possibilities • Increase Sales • Reduce Costs • Improve Project Planning • Reduce employee turnover • Effective training and on-boarding costs • Improve Data input – Billing & Payroll • Reduce/Conserve Operating costs • Enhance value of product (strengthen pricing) • Improve training & cross-training • Have smooth succession planning in place 11
Defining Assets Definition What we have and how well we use what we have. Asset Strength – the ability to remain viable during ups and downs in the marketplace. Asset Utilization – the ability to efficiently and effectively use assets to generate profits. Measures Return on Assets (ROA) – Percent value of Net Profit to Total Assets. Revenue per Employee - Company efficiency measure that reflects employee count and revenues. 12
Assets in Action The modern charcoal briquette was invented by automaker Henry Ford. Ford operated a sawmill in the forests around Iron Mountain, Michigan, in the years prior to 1920 to make wooden parts for his Model T. As the piles of wood scraps began to grow, so did Ford's eagerness to find an efficient way of using them. He learned of a process developed and patented by Orin F. Stafford. The process involved chipping wood into small pieces, converting it into charcoal, grinding the charcoal into powder, adding a binder and compressing the mix into the now-familiar, pillow-shaped briquette. By 1921, a charcoal-making plant was in full operation.
ASSETS Review • Define Asset Driver • What we have and how well we use what we have. 2. Measures of Asset 1. ROA – Percent value of Net Profit to Total Assets. 2. Revenue per Employee – Company efficiency measure that reflects employee count and revenues. 3. Importance of Asset Driver - Demonstrates ability to work smarter rather than harder. - Indicates company invests in “right” assets - Indication of execution & efficiency • Benchmark the numbers • 200820092010 • Rev./Employee • $378,000 $354,000 $352,000 13
Defining Growth Definition The ability to increase year over year, quarter over quarter, and/or month over month. “In today’s business world, no growth means lagging behind in a world that grows every day…” “Investors expect it, employees are energized by it, customers are generally attracted to it and executives are measured by it.” Measures Revenue Growth – Top-line Sales/Revenues increase. EBITDA Growth – ‘Controllable’ Profit increase. Net Profit Growth – Bottom-line / Profit increase. 14
Facing Rapid Decline • Best & brightest leave first. • Productivity goes down. • Morale goes down. • Costs are cut, which limits ability to grow, • company becomes less profitable. Studies Show: It usually takes 4 or 5 years for the company to recover.
Facing Rapid Growth • Attracts/Retains the best & brightest! • Productivity goes up = more profit = more • cash = more ability to grow! • Morale is high. • You have the ability to grow in your career! • Growth gets more time & attention than any of the 5 elements in a public company.
GROWTH Review • Define Growth Driver • The ability to increase year over year, quarter over quarter, and/or month over month. 2. Measures of Growth 1. Revenue Growth – Top-line Sales/Revenues increase. 2. Net Income Growth – Bottom-line / Profit increase. 3. Cost of Capital – Opportunity cost of funds deployed in an investment. • Define Growth Driver • The ability to increase year over year, quarter over quarter, and/or month over month. 2. Measures of Growth 1. Revenue Growth – Top-line Sales/Revenues increase. 2. EBITDA – ‘Controllable’ Profits increase 2. Net Profit Growth – Bottom-line / Profit increase. • Benchmark the numbers • 200820092010 • Rev Growth ??% ??% ??% • Net Growth ??% ??% ??% • Cost of Cap. ??% ??% ??% 3. Importance of Growth Driver “Investors expect it, employees are energized by it, customers are generally attracted to it and executives are measured by it.” • Benchmark the numbers • 20092010 • Sales Growth -25.9% 3.4% • EBITDA Growth 78.34% 14.24% • Net Profit Growth 363.09% 30.05% 15
Large Group Discussion What can you do to positively impact focusing on Growth. Possibilities • Increase global services. • Provide exceptional service. • Invest in employees. • Better utilize marketing. • Play a part in culture shaping. • Hire talent that is strong and adaptable. • Create customer loyalty. • Develop great leaders. • Anticipate employee needs that will support a growth strategy. • Increase; customers, revenues, & product offerings • Sell value 15
Defining PEOPLE Definition The External Customer, Vendor/Re-seller, or Internal Customer that has the ability to impact the success of the business. Measures Expressions of Interest (EOI) – The number of times a visitor clicks on a listing. Net Promoter Score (NPS) – Customer Care Satisfaction score. 16
What is more important than meeting customer expectations? Exceeding? Anticipating Customer Needs & Expectations! “If I would have asked my customer what they wanted, they would have said a faster horse!” ~Henry Ford
Failing to Anticipate Customer What companies have failed to anticipate customer expectations? What were the results? • GM/Ford • Kodak • IBM • Sony – Unprepared for recession and required government bailout money. Ford secured line of credit prior and retained full ownership. – decided to move to digital product line. Polaroid did not and is no longer a serious competitor. – In 1943, the CEO said the customer need for their product was approximately 5 computers for the entire world. – Did not move to a digital music player and lost a significant market share to innovative companies like Apple and Motorola.
Benchmark PEOPLE NPS – 2011 is currently 84%. 2010 Net Promoter Scores – USAA = 81%, Apple = 78%, Facebook = 65%, Google = 63% 17
PEOPLE Review • Define People Driver • The External Customer, Vendor/Re-seller, or Internal Customer that has the ability to impact the success of the business.. 2. Measures of People 1. Expressions of Interest (EOI) – The number of times a visitor clicks on a listing. 2. Net Promoter Score (NPS) – Customer Care Satisfaction score. • Importance of People Driver • - Without People, then what happens? • - Anticipate and then exceed expectations. • - Customer service is for everyone; Internal, External, Vendors. • Benchmark the numbers • 200820092010 • EOI 236.3M 261.9M 285.5M • NPS 62% 71% 77% 17
5 Business Driver Ranking Rank the 5 Business Drivers in order based on the driver you have the greatest impact / influence or (based on your role) is the most important to the success of careerbuilder. 1.) Most important 2.) 3.) 4.) 5.) Least important Be prepared to share your list with the class. 38
Demystifying the Annual Report The Annual Report & Financial Statements Letter to the Share Holders: Identify which drivers are being focused on. Understand the strategic goal(s) Financial Statements: Identify the equation. Recognize the purpose of the statement. Locate the key numbers/measures. How do I impact each statement? CAN YOU READ THIS? 21
Equation: Revenue – Expenses = Profit Purpose: Identify Profitability Total Revenue - Top-line Cost of Revenue - Cost of Goods Sold (COGS) Gross Margin $60,650 / $111,055 = 54.6% Operating Profit – Operating Income – EBIT Net Margin $12,535 / $111,055 = 11.3% Net Profit – Net Income – Bottom-line 24
Equation: Assets = Liabilities + Equity Purpose: Financial Strength Most Liquid Least Liquid (1yr.) Current Ratio Current Assets / Current Liabilities 24,334 / 36,705 = .663 Equity Ratio Total Equity / Total Assets $101,900 / $268,752 = 38% 26
Equation: Cash from Operations +/- Cash from Investing +/- Cash from Financing = Net Change in Cash Purpose: Cash Management Earn It (Core Business) Sell Assets Borrow It 28
140 584 66 66 584 11.38 584 503 80.37 584 1658 .352 565 584 3.4 66 51 30.0 80.37 70.35 14.2 285.5 77% 35
Individual Action Plan (Page 52) • Review: • What new insights did you gain, • as a result of attending? (Page 53) • Action Plan: • List the things you can commit to do: • Cash: (refer to page 9) • Profit: (refer to page 11) • Assets: (refer to page 13) • Growth: (refer to page 15) • People: (refer to page 17) 53
Content Retention Time Retaining Content over Time • Review • Apply • Teach 15% 52
Acumen Accountability Find a Partner now and: • Set up a specific date and time in 30 days to report your progress on your action plan. • Exchange emails • Exchange phone numbers • Decide who will initiate the call • Determine a back-up plan • Transfer this information to your planner or PDA now.
Locating Financial Information • Web Sites: • www.nasdaq.com • www.reuters.com • www.yahoo.com • www.finance.google.com • www.hoovers.com • www.smartmoney.com 55
One Final Thought… “People will work hard for a paycheck, harder for a person, and hardest for a reason.”