Download
1 / 31
310 likes | 426 Vues
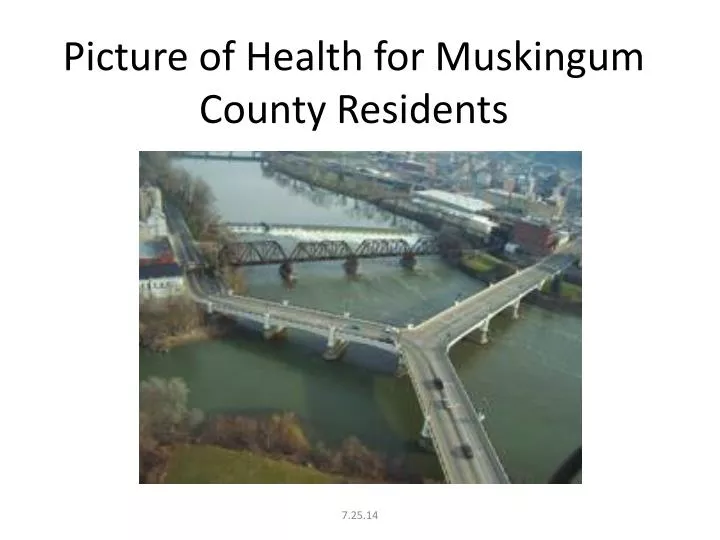
Picture of Health for Muskingum County Residents. Introduction.

E N D
Introduction Muskingum County is located east of Columbus, Ohio, our state capital. Ebenezer Zane made a settlement here when he stopped on his way from Wheeling, now West Virginia, to Maysville, Kentucky. He was clearing a road called Zane's Trace that ran across Ohio. Zanesville was established on March 1, 1804, by Zane's son-in-law, John McIntire. He stayed in Zanesville and developed what would become Ohio's second capital from 1810- 1812. Muskingum County was a hub of river traffic and is famous for the "Y" Bridge which was built at the confluence of the Muskingum and Licking Rivers. The county got its name from the Native American term , Moos-kin-gung meaning "a town on the side of the river." Some claim the natives called it the "Elk Eye River.“ Muskingum County contains a land area of 673 square miles, with Zanesville as its county seat. 7.25.14
Demographics Residents are predominantly white at 93%. (US Census Bureau QuickFacts 2011). 2.6% of residents have a language other than English spoken at home age 5+ (Ohio 6.3%)-US Census Bureau QuickFacts 2006-2010. Our county is designated as Appalachian by the federal government. Appalachian counties with their geographic cultures and history can be disproportionately affected by health issues. 72% of respondents’ grandparents and/or parents are from Appalachia *Muskingum County Health Survey (MCHS) 2011 7.25.14
Goal I: Public health efforts incorporate partners, programs and policies that can affect the social issues and challenges that are characteristic of the local residents and could improve health status In Muskingum County, poverty has an overwhelming impact on our community’s health. Our poverty level is higher than the state, our median household income is lower than the state, and families continue to lose their homes due to foreclosure stemming from financial difficulties. 17.3% persons below poverty level (Ohio 15.4%) *US Census Bureau QuickFacts (QuickFacts) 2008-2012 31% of children are in poverty (Ohio 23.6%) *Kids Count 2012 7.25.14
Income and Unemployment 24% have inadequate social support (Ohio 20%) *2014 County Health Rankings Median household income $40,398 (Ohio $48,246) *QuickFacts 2008-2012 In Appalachia, much of the county is rural farmland. As our county lost large industries such steel and pottery or the industry moved into the more technological era, jobs became scarce. The Appalachia jobs focused on using natural resources such as timber, coal, and farm production reduced dramatically. These natural resource jobs required little education for residents and matched workers who had historically relied on agriculture and manufacturing. Unemployment rates for the county have improved but continue to be lower than the state rates. 432 homes faces foreclosure in Muskingum County *Policy Matters of Ohio 2012 10.7% of individuals (Ohio 6.9%) unemployment *Ohio Department of Job and Family Services 2013 7.25.14
Children in Poverty Children are particularly vulnerable to the affects of poverty in their living environments, relationships, school achievements and potential for unhealthy behaviors. Poverty also affects households with a larger percentage of female heads of households with children under the age of 18 years. Baseline: 33.3% of households with children under the age of 18 were headed by females (Ohio 28%) *US Census Bureau American Community Survey (ACS) 2012 7.25.14
Education Age 25 and older 13.4% of individuals have less than a high school diploma (Ohio 11.8%) *QuickFacts 2008-2012 Education is a key to improving employment opportunities and to create occupations with higher incomes. The higher the level of education, the more knowledge and exposure to healthy lifestyle choices for the residents and families. Age 25 and older below poverty level, 27.5% (Ohio 28.4%) have less than a high school diploma *ACS 2012 Age 25 and older 86.5% of individuals are high school graduates (Ohio 87.8%) *QuickFacts 2007-2011 Age 25 and older 30.9% have some college or an Associate’s degree (Ohio 29%) %) *ACS 2012 Age 25 and older 13.8% have a Bachelor’s degree or higher (Ohio 24.7%) *QuickFacts 2008-2012 7.25.14
Homelessness In order to ensure the health of residents and their families, safe and affordable housing is essential. Our county has homeless individuals and families and many who live with friends or family in times of crisis (couch surfing). Expanded housing is needed for families to experience permanent healthy living environments that are free from discrimination . 42 persons were in shelters and 25 on the streets for the homeless count *Muskingum County Continuum of Care 2013 672 calls for the 211 system were for housing/shelter*United Way of Muskingum, Perry and Morgan Counties 2009-2012 Crime Reducing the risk of youth entering the justice system and reducing recidivism can be accomplished through collaborations to create continuity of services to the youth and their families, Expansion of support for prevention of adjudication, services during their incarceration will improve overall health of offenders, and building continuing support in their transition back into the community. 32 adolescents adjudicated for felonies *Kids Count Data Center (KCDC) 2012 7.25.14
Goal II: behavioral health providers collaborate to integrate physical and mental health practices Residents of our county suffer addictions at higher levels than the state for opiate addictions, tobacco addictions. Alcohol addictions affect a high percentage of residents and their overall health. All these additions plus other drugs are putting residents at risk of chronic diseases, injuries, social and behavioral problems and even death. Data related to alcohol abuse and tobacco usage will be covered in Goals IV and V. *Ohio Automated RX Reporting System (OARRS) 4th quarter 2013 7.25.14
Abuse of Alcohol, Tobacco, & Other Drugs 90.3 (Ohio 64.9) doses per capita of prescription opiates consumed annually *Ohio Mental Health Services 2013 0/100,000 opiate related poisoning deaths (Ohio 10) * State Epidemiological Outcomes Data Group 2011 8.13/100,000 unintentional drug related deaths (Ohio 16.59) * State Epidemiological Outcomes Data Group 2012 7.25.14
Depression, anxiety, mood disorders, and Severe mental illness Mental health is a key component of overall good health. And, links between mental health and chronic medical conditions are established through scientific literature. Mood disorders and adjustment disorders are top mental health issues. When asked about their mental health, which includes stress, depression, and problems with emotions, respondents answered 3.3 days during the past 30 days their mental health not good (Ohio 19.2%) *Behavioral Risk Factor Surveillance Survey (BRFSS) 2& Network of Care 2004-2010 43% of Six County clients have mood disorders and 25% adjustment disorders *Six County Inc. 2011 7.25.14
Suicide Suicides are increasing at an alarming rate in our county and at the state and national levels. Efforts will focus on increasing awareness about underlying causes and warning signs of potential suicide thoughts. Age adjusted deaths due to suicide 19.9/100,000 (Ohio 12) *ODH Vital Statistics & Network of Care 2009-2011 Intentional self harm (Suicide) by other and unspecified means rate of 7.1/100,000 (Ohio 5.8) *ODH Warehouse 2006-2008 7.25.14
Goal III: Decrease risk of heart diseases Diseases of the heart are the second leading cause of death to residents of the county next to cancer. Risk of heart disease is radically increased with lack of physical activity , poor nutrition, and high levels of obesity Rate of deaths from heart disease 202.1/100,000 (Ohio 191.7) *ODH Vital Statistics 2010 Rate of death from aortic aneurysm 4.3/100,000 (Ohio 3.7) *ODH Vital Statistics & Network of Care 2009-2011 Death rate for coronary heart disease 119.2/100,000 (Ohio 144.5) *ODH Vital Statistics & Network of Care 2004-2010 7.25.14
Physical Activity Lack of physical activity contributes to risk of many chronic diseases including heart disease, cancer, arthritis, and diabetes. Building physical activity supports back in the community design and everyday life can improve residents and families’ health and the overall health of the community. During the past month, 26.6% respondents reported other than their regular job, did not participate in any physical activities or exercises such as running, calisthenics, golf, gardening, or walking for exercise (Ohio 25.1%) *BRFSS & Network of Care 2004-2010 Nutrition Healthy nutrition is a foundation of health. Poor nutrition can lead to increased risk of high blood pressure, high cholesterol, diabetes, and ultimately heart disease. Eating in a balanced and healthy way as individuals, families, in schools, and as a community can improve our overall health. 78.4% of adults reported fewer than 5 servings of fruits/vegetables per day(Ohio 78.2%) *BRFSS & Network of Care 2003-2009 50% eat healthy most of the time *MCHS 2011 Reasons don’t serve fresh fruits/vegetables: 32% cost high, 29% cannot keep them long without going bad, 15% few they like/don’t like them, 13% eat on run/eat out, and 0% cannot get to a store with them *MCHS 2011 7.25.14
Obesity Contributing factors for obesity include excess nutrition, lack of physical activity, and family history. Other forces affecting the community contribute to obesity such as poverty, unemployment, lack of access to healthy foods, lack of education and community design. Obesity raises residents’ risk of high blood pressure, high cholesterol, diabetes and heart disease. 22.8% adults body mass index greater than 30 (Ohio 27.8%) *BRFSS Snapshot 2010 15.8% children ages 2-5 overweight (Ohio 28.2%) *Child and Family Health Services (CFHS) 2013 10% children ages 2-5 overweight (Ohio 12.4%) *CFHS 2013 36.4% 3rd grade children overweight or obese (Ohio 34.7%) *ODH A Report on the Body Mass Index of Ohio’s Third Graders 2004–2010 7.25.14
Goal IV: People are Free of Cancer Cancer deaths are the number one rate of mortality for Muskingum County. In order to address this devastating chronic condition, individuals need to take advantage of preventive screenings to detect cancer and to improve their health lifestyles to reduce risk of cancer such as healthy eating. Cancer prevalence in our county puts our residents at risk for many cancers including lung and bronchus. 70/100,000 age adjusted rate of deaths for lung cancer (Ohio 57.1) *National Cancer Institute & Network of Care 2004-2010 259.2/100,000 rate of deaths for cancer overall (Ohio 217.5) *National Vital Statistics & Network of Care 2004-2010 7.25.14
Tobacco Use Over the last 40 years, tobacco use has steadily declined across the state and nationally. These declines were due to major policy changes such as the release of the Surgeon General’s report on the harmfulness of using tobacco, the ban of tobacco advertising on television, increases in tobacco taxes, and smoke free workplaces, restaurants, and other schools. The percent of residents who smoke remains higher than the state in our county. Second hand smoke creates health problems for those around smokers such as asthma. 23% are currently smokes every day or “most days” and has smoked at least 100 cigarettes in their lifetime. (Ohio 21%) *BRFSS & Network of Care 2006-2012 2.7% current users of smokeless tobacco (Ohio 2.7%) *HOCPMC 2008 18.5% children with asthma (Ohio 15.4%) *ODH & Network of Care 2008 7.25.14
Preventive Screenings for Cancer Preventive screenings for cancer can help residents to detect and treat cancer early which can prolong life and decrease the devastating health effects of advanced cancer. Residents are at risk for breast, cervical, prostate, and colon. 72.1% females had a Pap test in past three years ages 18+ cervix intact (Ohio 76.5) *BRFSS Snapshot 2010 86.1% females had a mammogram in past two years ages 50+ (Ohio 79.2%) *BRFSS & Network of Care 2004-2010 45.7% males had a prostate-specific Antigen test in past 2 year ages 40+ (Ohio 55.1%) *BRFSS Snapshot 2010 53.9% ever had a colonoscopy/sigmoidoscopy ages 50+ *BRFSS & Network of Care 2008-2010 23.1% ages 50+ had blood stool test in past two years (Ohio 18.1%) *BRFSS Snapshot 2010 49.8% males had a digital rectal exam in past year ages 50+ (Ohio 57.5%) *BRFSS Snapshot 2010 7.25.14
Goal V: All Injuries are Prevented Impaired driving deaths from alcohol and drug use and injuries related to accidents have steadily increased in Muskingum County. HMCN will increase collaborative efforts with mental health and safety agencies to address this urgent health issue for our residents. Other emerging issues such as texting and driving, fatigue driving, car surfing, and farm injuries will require community attention. Distracted or Impaired Driving of Adults and Adolescents 17% binge drink (Ohio 18%) *BRFSS & Network of Care 2006-2012 40% had any drink in the last month (Ohio 46.6%) *BRFSS Snapshot 2010 Decrease drinking alcohol and driving 10% to 5% for those who sometimes drink and drive, who has been drinking and increase from 9% to 14% those who always use a designated driver *MCHS 2011 7.25.14
Decreasing Abuse and Neglect of Adults and Children Neglect and abuse of adults and children in MC is a urgent health issue for individuals, families and the community. Protecting this vulnerable portion of our community takes the dedicated work of our county agencies such as MC Children Services, law enforcement, as well as other collaborative partners to reduce the risk of harm to children and adults. 892 new reports of neglect and abuse of children *Public Children Services Association of Ohio (PCSAO) 2011 the number of new allegations of abuse and neglect of children 892 in 2011 has increased by 15% since 2005 at 758 *PCSAO 2011 Of the children in custody, the following are the percentages for each placement type: 59% licensed foster home (Ohio 62% ), 15% approved relative/kinship home (Ohio 17%), 17% group/residential care (Ohio 13%), 0% adoptive placement (Ohio 1%), and 9% independent living placement order (Ohio 7%) *PCSAO 2011 440-590 women age 18+ suffered physical intimate partner violence *Ohio Family Violence Prevention Project (OFVPP) 2010 740-950 senior age 60+ suffer elder abuse/neglect *OFVPP 2010 7.25.14
Improving Safety of Residents from Fire Hazards Fire hazards can cause loss of property, injury and potentially death for individuals, families and the community. Preventing fires can be achieved by increasing the use by residents of fire extinguishers, smoke detectors, and carbon monoxide detectors. 89% have smoke detectors, 55% have fire extinguishers, and 39% have carbon monoxide detectors *MCHS 2011 7.25.14
Goal VI: Mothers and Babies are Healthy Improving the Health of Mothers and Children Mothers are at higher risk during pregnancy than the state for several key reasons. Mothers with medical risk factors are higher, more mothers smoke, the teen birth rate is higher, birth weights are lower, and more women have Cesarean Section births. Our mothers are seeking prenatal earlier than the state and this is a positive health factor that must be capitalized on in preventive strategies. Births to mothers who smoked 25.9% (Ohio 17.9%) *ODH Vital Statistics 2010 Teen births rate ages 15-17 16.3/1000 (Ohio 15.6) *ODH Vital Statistics 2010 Mothers with medical risk factors during pregnancy per 100 live births 71.8% (Ohio 45.6%) *ODH Warehouse 2005 Births with first trimester prenatal care 81% (Ohio 73%) * ODH Vital Statistics 2010 Women delivering by Cesarean section 37% (Ohio 30.6%) *ODH Data Warehouse 2008 7.25.14
Improving the Health of Mothers and Children Infant mortality rate 3.93 (Ohio 7.57) *ODHVS 2012 Black Infant mortality rate 45.45 (Ohio 15.96) *ODHVS 2011 Babies with low birth weight 9.1% (Ohio 8.6%) *ODH Vital Statistics 2010 Pre-term babies < 37 weeks rate 14.2% (Ohio 12.7%) *Health Indicators Warehouse Network of Care 2011 7.25.14
Goal VII: Everyone Lives in a Healthy Home Residents Live in a Healthy Home Living in a healthy environment affects the overall health of all the residents in that home. Safe pleasant tasting drinking water is important. It is also a priority to reduce the allergens in the home such as mold and mildew that can lead to asthma in children. Older homes are at higher risk of lead poisoning for children living there. 51% of residents drink tap water-S 2010 *MCHS 2011 Adults ever told have asthma 15.7% (Ohio 13.3%) *BRFSS Snapshot 2010 Adults who still have asthma 74.2% (Ohio 72.9%) *BRFSS Snapshot 2010 Muskingum County ranks 40th of 88 for the highest % of confirmed elevated blood lead levels *ODH Childhood Lead Program 7.25.14
Goal VIII: People actively pursue Primary prevention Services Reducing Health Risks Through Prevention In order to reduce chronic illnesses, prevention efforts have to focus on reducing risk factors for those conditions. Screening and education are keys to reducing health risks. Regular check-ups, diabetes & cholesterol & blood pressure screening, and flu and pneumonia shots are essential parts of preventive health 15.2% adults ever diagnosed with diabetes (Ohio 14%) *BRFSS Snapshot 2010 68.2% adults ages 65+ ever had a pneumonia shot (Ohio 61.6%) *BRFSS Snapshot 2010 35% adults reporting to have high cholesterol (Ohio 34.7%) *Appalachia BRFSS 2002 65% got regular check-ups, 42% get regular dental check-ups, 35% get screened when they are supposed to, 30% immunizations are up to date, 15% just wait and see, 12% are healthy and don’t need a doctor, and 9% want to see a doctor but cannot afford it *MCHS 2011 33.6% adults ever report having high blood pressure (Ohio 28.2%) *BRFSS & Network of Care 2003-2009 76.6% Flu vaccination for adults ages 65+ (Ohio 67.8%) *BRFSS & Network of Care 2008-2010 7.25.14
Goal IX: People have Equal Access to Health care All residents need to have equal access to healthcare which will require increasing the number of adults and children with insurance and increasing the availability of affordable, quality healthcare services. Partnerships will be necessary bridging the gap between individual and family healthcare access and the community support necessary to maintain good health. HMCN will strive to increase access to health care for all residents. Increasing Adults and Children Who Have Insurance for Health Care The uninsured rates for our county do not paint a complete picture of the issues existing for access to care through residents have the necessary health insurance coverage . Many residents cannot afford fee for services care and issues exist with residents covered under Medicaid and Medicare and those that need this coverage. Data is needed to further assess the insurance needs of residents and to prepare for residents to use the health insurance exchanges under development nationally. 6% of children are uninsured *CFHS 2014 18.2% adults are uninsured (Ohio 21%) *ACS Network of Care 2008-2012 7.25.14
Increasing Access to Health Care Services: Particularly Dental Services Access to care, particularly dental care, will need continued attention by the healthcare system, public health and community agencies. Great strides have been made to increase access through the addition of our Muskingum Valley Health Center, the federally qualified health center, and the expansion of services for our community by Genesis HealthCare System. But the unified efforts with public health and other agencies will build the supports necessary to decrease health risks and support healthy lifestyles which will reduce chronic diseases and their debilitating effects. Baseline: 26.5% 3rd graders had urgent or early dental needs (Ohio 18.8%) from ODH 2009-2010 Oral Health Survey Baseline: 56.3% 3rd graders with a history of tooth decay (Ohio 51.2%) *ODH Oral Health Survey 2009-2010 7.25.14
Data Sources Behavioral Risk Factor Surveillance System (BRFSS) Snapshot data: Zanesville-Muskingum County Health Department Centers for Disease Control and Prevention’s BRFSS: http://www.cdc.gov/brfss/ Child and Family Heath Services County Profiles: http://www.odh.ohio.gov/odhprograms/cfhs/cf_hlth/cfhs1.aspx Health Indicators: http://healthindicators.gov/Indicators/Selection Healthy Ohio Community Profiles: http://www.healthyohioprogram.org/resources/datareports/profiles.aspx Kids Count Data Center (KCDC): http://datacenter.kidscount.org/ Muskingum County Continuum of Care homeless count 2011 Muskingum County Health Survey (MCHS) 2011: a survey of 740 Muskingum County residents Network of Care Muskingum County: http://muskingum.oh.networkofcare.org/ph/ 7.25.14
Data Sources ODH A Report on the Body Mass Index of Ohio’s Third Graders 2004–2010: http://www.odh.ohio.gov/~/media/ODH/ASSETS/Files/health%20resources/reports/2011bmireport.ashx ODH Oral Health Survey of 3rd graders: http://www.odh.ohio.gov/odhPrograms/ohs/oral/oralfeatures/OHS.aspx Ohio Attorney General 2010 foreclosure data: http://www.policymattersohio.org/wp-content/uploads/2012/04/Foreclosure_April20121.pdf Ohio Automated RX Reporting System: https://www.ohiopmp.gov/portal/default.aspx Ohio Cancer Incidence Surveillance System: http://www.odh.ohio.gov/healthstats/ocisshs/newrpts1.aspx Ohio Childhood Lead Poisoning children with elevated blood level data: http://www.odh.ohio.gov/odhprograms/cfhs/lead_ch/lead_data.aspx Ohio Department of Education students at poverty level data: http://www.ode.state.oh.us/GD/Templates/Pages/ODE/ODEPrimary.aspx?page=2&TopicRelationID=390 7.25.14
Data Sources • Ohio Department of Job and Family Services unemployment data: http://jfs.ohio.gov/ocomm/index.stm • Ohio Family Health Survey now the Ohio Medicaid Assessment Survey: http://grc.osu.edu/omas/article.cfm?id=7753 • Ohio Family Violence Prevention Project: http://www.healthpolicyohio.org/special-projects/ohio-family-violence-prevention-project/ • Public Children Services Association of Ohio: http://www.pcsao.org/coa.htm • Realtytrac data: http://www.realtytrac.com/statsandtrends/foreclosuretrends/oh/muskingum-county • Six County Inc. data • United Way of Muskingum, Perry, and Morgan Counties 211 data • US Census Bureau American Community Survey: http://www.census.gov/acs/www/ • US Census Bureau QuickFacts (QuickFacts): http://quickfacts.census.gov/qfd/index.html 7.25.14
If you would like more information about this report, please call Jody Stones MEd, Zanesville-Muskingum County Health District Community Health Planner at 740-454-9741 extension 269 or email her at jlstones@zmchd.org 7.25.14