Download
1 / 1
10 likes | 68 Vues
Select the links found in both the coexrpression networks, according to Homologene. A-GCN. S-GCN. Random permutation. GENERATION AND ANALYSIS OF HUMAN-MOUSE CONSERVED COEXPRESSION NETWORKS

E N D
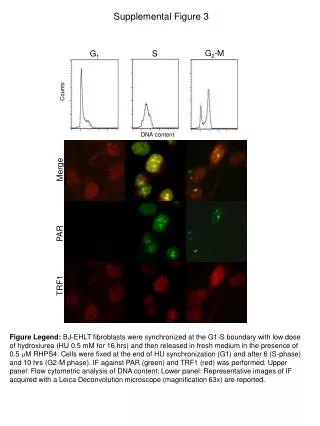
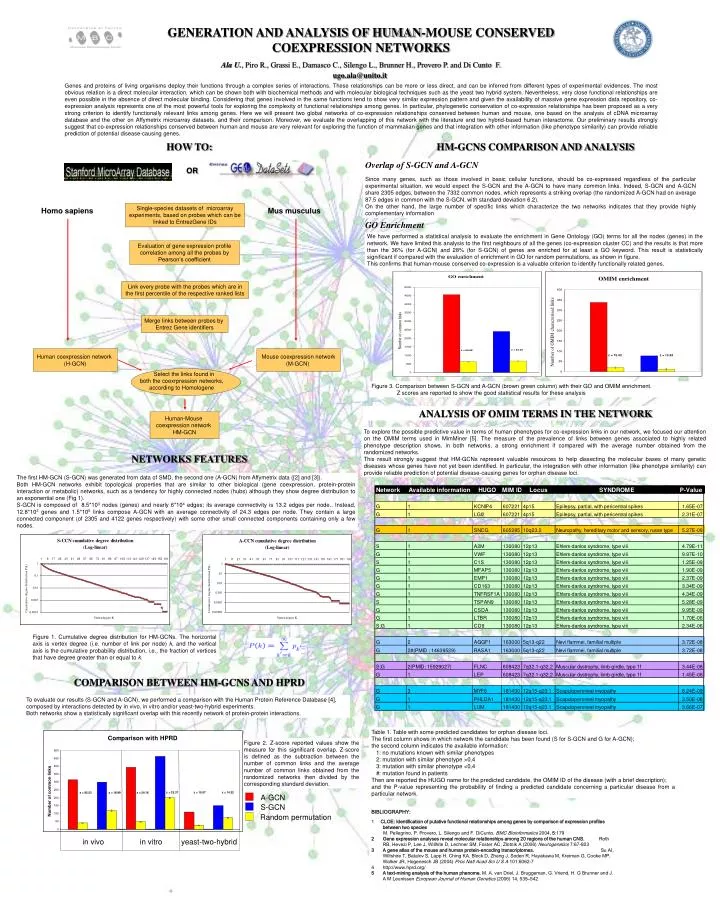
Select the links found in both the coexrpression networks, according to Homologene A-GCN S-GCN Random permutation GENERATION AND ANALYSIS OF HUMAN-MOUSE CONSERVED COEXPRESSION NETWORKS Ala U.,Piro R., Grassi E., Damasco C., Silengo L., Brunner H., Provero P.and Di Cunto F.ugo.ala@unito.it Genes and proteins of living organisms deploy their functions through a complex series of interactions. These relationships can be more or less direct, and can be inferred from different types of experimental evidences. The most obvious relation is a direct molecular interaction, which can be shown both with biochemical methods and with molecular biological techniques such as the yeast two hybrid system. Nevertheless, very close functional relationships are even possible in the absence of direct molecular binding. Considering that genes involved in the same functions tend to show very similar expression pattern and given the availability of massive gene expression data repository, co-expression analysis represents one of the most powerful tools for exploring the complexity of functional relationships among genes. In particular, phylogenetic conservation of co-expression relationships has been proposed as a very strong criterion to identify functionally relevant links among genes. Here we will present two global networks of co-expression relationships conserved between human and mouse, one based on the analysis of cDNA microarray database and the other on Affymetrix microarray datasets, and their comparison. Moreover, we evaluate the overlapping of this network with the literature and two hybrid-based human interactome. Our preliminary results strongly suggest that co-expression relationships conserved between human and mouse are very relevant for exploring the function of mammalian genes and that integration with other information (like phenotype similarity) can provide reliable prediction of potential disease-causing genes. HOW TO: HM-GCNS COMPARISON AND ANALYSIS Overlap of S-GCN and A-GCN Since many genes, such as those involved in basic cellular functions, should be co-expressed regardless of the particular experimental situation, we would expect the S-GCN and the A-GCN to have many common links. Indeed, S-GCN and A-GCN share 2305 edges, between the 7332 common nodes, which represents a striking overlap (the randomized A-GCN had on average 87.5 edges in common with the S-GCN, with standard deviation 6.2). On the other hand, the large number of specific links which characterize the two networks indicates that they provide highly complementary information OR Single-species datasets of microarray experiments, based on probes which can be linked to EntrezGene IDs Homo sapiens Mus musculus GO Enrichment We have performed a statistical analysis to evaluate the enrichment in Gene Ontology (GO) terms for all the nodes (genes) in the network. We have limited this analysis to the first neighbours of all the genes (co-expression cluster CC) and the results is that more than the 36% (for A-GCN) and 28% (for S-GCN) of genes are enriched for at least a GO keyword. This result is statistically significant if compared with the evaluation of enrichment in GO for random permutations, as shown in figure. This confirms that human-mouse conserved co-expression is a valuable criterion to identify functionally related genes. Evaluation of gene expression profile correlation among all the probes by Pearson’s coefficient Link every probe with the probes which are in the first percentile of the respective ranked lists Merge links between probes by Entrez Gene identifiers Human coexpression network (H-GCN) Mouse coexpression network (M-GCN) Figure 3. Comparison between S-GCN and A-GCN (brown green column) with their GO and OMIM enrichment. Z scores are reported to show the good statistical results for these analysis ANALYSIS OF OMIM TERMS IN THE NETWORK Human-Mouse coexpression network HM-GCN To explore the possible predictive value in terms of human phenotypes for co-expression links in our network, we focused our attention on the OMIM terms used in MimMiner [5]. The measure of the prevalence of links between genes associated to highly related phenotype description shows, in both networks, a strong enrichment if compared with the average number obtained from the randomized networks. This result strongly suggest that HM-GCNs represent valuable resources to help dissecting the molecular bases of many genetic diseases whose genes have not yet been identified. In particular, the integration with other information (like phenotype similarity) can provide reliable prediction of potential disease-causing genes for orphan disease loci. NETWORKS FEATURES The first HM-GCN (S-GCN) was generated from data of SMD, the second one (A-GCN) from Affymetrix data ([2] and [3]). Both HM-GCN networks exhibit topological properties that are similar to other biological (gene coexpression, protein-protein interaction or metabolic) networks, such as a tendency for highly connected nodes (hubs) although they show degree distribution to an exponential one (Fig 1). S-GCN is composed of 8.5*103 nodes (genes) and nearly 6*104 edges; its average connectivity is 13.2 edges per node.. Instead, 12.8*103 genes and 1.5*105 links compose A-GCN with an average connectivity of 24.3 edges per node. They contain a large connected component (of 2305 and 4122 genes respectively) with some other small connected components containing only a few nodes. Figure 1. Cumulative degree distribution for HM-GCNs. The horizontal axis is vertex degree (i.e. number of link per node) k, and the vertical axis is the cumulative probability distribution, i.e., the fraction of vertices that have degree greater than or equal to k. COMPARISON BETWEEN HM-GCNS AND HPRD To evaluate our results (S-GCN and A-GCN), we performed a comparison with the Human Protein Reference Database [4], composed by interactions detected by in vivo, in vitro and/or yeast-two-hybrid experiments. Both networks show a statistically significant overlap with this recently network of protein-protein interactions. Table 1. Table with some predicted candidates for orphan disease loci. The first column shows in which network the candidate has been found (S for S-GCN and G for A-GCN); the second column indicates the available information: 1: no mutations known with similar phenotypes 2: mutation with similar phenotype >0,4 3: mutation with similar phenotype <0,4 #: mutation found in patients Then are reported the HUGO name for the predicted candidate, the OMIM ID of the disease (with a brief description); and the P-value representing the probability of finding a predicted candidate concerning a particular disease from a particular network. Figure 2. Z-score reported values show the measure for this significant overlap. Z-score is defined as the subtraction between the number of common links and the average number of common links obtained from the randomized networks then divided by the corresponding standard deviation. • BIBLIOGRAPHY: • 1 CLOE: Identification of putative functional relationships among genes by comparison of expression profiles between two species • M. Pellegrino, P. Provero, L. Silengo and F. DiCunto. BMC Bioinformatics 2004, 5:179 • Gene expression analyses reveal molecular relationships among 20 regions of the human CNS. Roth RB, Hevezi P, Lee J, Willhite D, Lechner SM, Foster AC, Zlotnik A (2006) Neurogenetics 7:67-803 • A gene atlas of the mouse and human protein-encoding transcriptomes.Su AI, Wiltshire T, Batalov S, Lapp H, Ching KA, Block D, Zhang J, Soden R, Hayakawa M, Kreiman G, Cooke MP, Walker JR, Hogenesch JB (2004)Proc Natl Acad Sci U S A 101:6062-7 • http://www.hprd.org/ • A text-mining analysis of the human phenome. M. A. van Driel, J. Bruggeman, G. Vriend, H. G Brunner and J. A M Leunissen European Journal of Human Genetics (2006) 14, 535–542 in vivo in vitro yeast-two-hybrid