Download

1 / 28
340 likes | 482 Vues
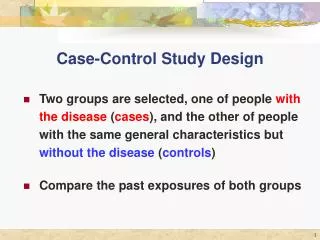
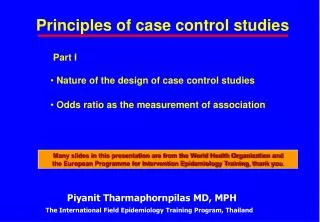
Variants of the case- control design. Katharina Alpers EPIET introductory course, Menorca (Spain), 10 October, 2011. Overview. Design of case-control studies Exclusive („traditional“) Inclusive („case-cohort“) Concurrent (density) Case-to-case Case-crossover.

E N D
Variants of the case- control design Katharina Alpers EPIET introductory course, Menorca (Spain), 10 October, 2011
Overview Design of case-control studies • Exclusive („traditional“) • Inclusive („case-cohort“) • Concurrent (density) • Case-to-case • Case-crossover
Cohort study: incidence risk Cumulative incidence Number of cases/population initially at risk
Cohort study: incidence rate Incidence density Number of cases/sum of times at risk
Cohort study Exposed population (E) Cases exposed Ce Initially at Risk Ne Person years at risk of exposed (pyare) Currently at risk Still at risk Ne - Ce Unexposed population (U) Cases unexposed CU Initially at Risk Nu Person years at risk of unexposed (pyaru) Currently at risk Still at risk Nu - Cu End of study Start of study Time Rodrigues L et al. Int J Epidemiol. 1990;19:205-13.
Case-control studies • Efficient for rare diseases • Compare exposure in cases to sample of population • sampled from source population that gives rise to cases • representative of exposure in source population • Sampling independent of exposure status • Different control sampling schemes
Cohort study Traditional case-control design (exclusive) Exposed population (E) Cases Cases exposed Still at risk Unexposed population (U) Cases unexposed Sample of “non cases” Still at risk End of study Time Rodrigues L et al. Int J Epidemiol. 1990;19:205-13.
Traditional design • Controls sampled from population still at risk at the end of the study period • Disease odds ratio = exposure odds ratio • If disease is rare: OR good estimate of risk ratio and rate ratio
Cohort study Inclusive design: Case cohort study Exposed population (E) Cases Cases exposed Still at risk Unexposed population (U) Cases unexposed Sample of source population Still at risk End of study Time Rodrigues L et al. Int J Epidemiol. 1990;19:205-13.
Case-cohort design • Control group estimates the proportion of the total population that is exposed • Controls selected from all individuals at risk at the start of the study • sampled regardless whether or not they will fall ill • Case may also be selected as a control and vice versa -> kept in both groups • OR estimates relative risk
Cohort study Concurrent design: density case control Exposed population (E) Cases exposed Cases Still at risk Unexposed population (U) Cases unexposed Sample of source population Still at risk Still at risk End of study Time Rodrigues L et al. Int J Epidemiol. 1990;19:205-13.
Concurrent design: density case control • Controls selected from those still at risk when a case occurs • Control can later become a case • Not vice versa -> cases no longer at risk • Controls who later become cases kept in both groups • Controls represent person years at risk experience among exposed and unexposed • Matched analysis on time of selection • OR estimates the rate ratio
How to select controls to estimate the respective measure of association Measure Design Formulation Alternative formulation Controls to be sampled from Risk ratio Inclusive Ce/Ne Cu/Nu Ce/Cu Ne/Nu Total study population regardless of past or future disease status Rate ratio Concurrent Ce/pyare Cu/pyaru Ce/Cu pyare/pyaru People currently at risk Odds ratio Exclusive Ce/(Ne- Ce) Cu/(Nu- Cu) Ce/Cu (Ne- Ce)/(Nu- Cu) People disease-free throughout study period Rodrigues L et al. Int J Epidemiol. 1990;19:205-13.
What design and when? • Rare diseases: all give similar results • Non-recurrent disease with high incidence -> Case cohort design (inclusive): OR relative Risk • Recurrent common disease -> Density case control design (concurrent): OR relative Rate • Probability or effect of exposure changes along time -> Density case control design: OR relativeRate • No need to quantify -> traditional design
Relationship between OR and RR, according to the primary attack rate (AR) Acknowledgements: Olivier le Polain, EPIET Cohort 15 HPA London Epidemiology Unit, UK
Cases detected by surveillance systems • Non-random selection process: • Host factors (eg. asymptomatic infections) • Different health care seeking behaviour • Incomplete lab investigation • Incomplete reporting • Differential recall • Between reported and not reported cases • Between cases and controls
Case-to-case approach Same disease, different subtypes/clones: Serotypes Phage types Antibiotic resistance patterns Controls = cases with non epidemic subtypes from same source population same susceptibility (underlying diseases) included as cases if they had the outbreak strain readily available Reduces selection AND recall bias Food-exposure collected before status is known
Two listeriosis outbreaks France, 1999-2000:two distinct PFGE patterns Cases October November December January February March 1999 2000 de Valk H et al. Am J Epidemiol 2001;154:944-50
Listeriosis outbreak cases and sporadic cases distinguished by routine PFGE, France, 1999-2000 Cases October November December January February March 1999 2000 de Valk H et al. Am J Epidemiol 2001;154:944-50
Case to case control study:controls selected among sporadic cases listeriosis outbreak, France, 1999-2000 Cases October November December January February March 1999 2000 de Valk H et al. Am J Epidemiol 2001;154:944-50
Outbreak of listeriosis, France, December 1999 - February 2000Results multivariable analysis (29 cases, 32 controls) *adjusted for underlying condition, pregnancy status and date of interview de Valk H et al. Am J Epidemiol 2001;154:944-50
Case-crossover design • Same person taken as its own control -> No between-persons confounding • Matched design: • Compare exposure in a risk period to one or more control periods • Only pairs of discordant periods used in the analysis • Acute diseases • Exposure • must vary over time • short induction and transient effect • sensitive to recall bias
Exposure Study Case-crossover design Cases Matched pairs 1 Discordant 0, 1 2 Discordant 1, 0 3 Concordant 1, 1 4 Concordant 0,0 “Wash out” Reference period Current period period
Prolonged Salmonella Typhimurium outbreak, FranceFood exposures in the risk and control period and matched OR for 17 nosocomial cases Risk Control Matched Foods period period 95% C.I. OR Exposed(%) Exposed(%) Veal 5 (29) 1 (6) 5 0,6 - 236,5 Pork 4 (23) 6 (35) 0,6 0,1 - 3,1 Hamburgers 13 (77) 5 (29) 5 1,1 - 46,9 Ham 6 (35) 5 (29) 1,5 0,2 - 17,9 Pâté 2 (12) 2 (12) 1 0,01 - 78,5 Chicken 2 (12) 3 (18) 1 0,01 - 78,5 Turkey 11 (65) 6 (35) 2,67 0,7 - 15,6 “Cordon bleu” 0 (0) 2 (12) - undefined undefined Lamb sausages 2 (12) 0 (0) - undefined Poultry sausages 2 (12) 0 (0) - Haegebaert S et al. Epidemiol infect 2003;130,1-5
Case-time controls: ORb for the time trend onset Cases:ORa for the exposure and the time trend Control period Risk period Time trend in exposure: Between period confounding Case-time control designORa/ORb = OR of exposure adjusted for time trend
Delivery -2 -1 1 2 3 4 5 6 7 8 9 -2 -1 1 2 3 4 5 6 7 8 9 Cases: Control period Risk period Controls: Folic acid antagonists (FAA) in pregnancy and congenital cardiovascular defects (CCD) • Case-crossover approach • Case: Woman who had a child with CCD (N=3870) • Exposure: FAA during 2nd & 3rd month of pregnancy • Control: Woman who had a child without CCD (N=8387) OR=1.0 (0.5-2.0) Case-time control OR = 1/0.3 = 2.9 (1.2-7.2) OR= 0.3 (0.2-0.6) Hernandez-Diaz S. Am J Epidemiol 2003;158:385-391
Conclusions • If you do not need that OR estimates correctly the RR -> “traditional design” • Otherwise, if you need OR RR-> identify the best design for each situation • If it is difficult to find appropriate controls • Case to case • Case-crossover
References • Rodrigues L et al. Int J Epidemiol 1990;19:205-13 • Rothman KJ. Epidemiology: an introduction. Oxford University Press 2002, 73-93 • Rothman KJ, Greenland S, Lash TL: Modern Epidemiology. 3. ed., Philadelphia: Lippincott Williams & Wilkins, 2008. Chapter 8: Case-Control Studies, 111-127 • McCarthy N, Giesecke J. 1 Int J Epidemiology 1999; 28, 764-8 • de Valk H et al. Am J Epidemiol 2001;154:944-50 • Haegebaert S et al. Epidemiol infect 2003;130,1-5 • Hernandez-Diaz S et al. Am J Epidemiol 2003;158:385-391 Further Reading • Suissa S. The case-time-control design. Epidemiology 1995;6:248-253. • Greenland S. Epidemiology. 1996; 7231-239. • Mittleman, Maclure, Robins. Am J Epidemiol 1995;142;1:91-98. • Karagiannis Iet.al. Epidemiol Infect 2010;138, 1726-1734