Download
1 / 33
361 likes | 3.72k Vues
This slideshow will demonstrate a sample differentiated lesson based on data.

E N D
Web 2.0 Demo Differentiated Instruction Tiffany Jones October 29, 2009
This demo will explain how data and technology can be used to differentiate and customize instructional activities for a class of students with diverse needs.
The Data • The following data was taken from Maryland Report Card for Bluford Drew Jemison MST Academy in Baltimore City Public School System.
MSA Math Data for Grade 6 Insight One: From 2008-2009, there was a 27.0 gain in proficiency status. Insight Two: In 2009, the number of advanced students decreased by 8.4 percentage points. Insight Three: The number of basic students decreased in 2009 by 8.5 percentage points.
Developing a Measurable Objective Based on the data, this is the measurable objective for improving instruction/increasing achievement: By June 2010, 6th grade students at Bluford Drew Jemison MST Academy will : -gain at least 5.5 percentage points in the proficient level -gain at least 9.0 percentage points in the advanced level -decrease at least 14.6 percentage points in the basic level
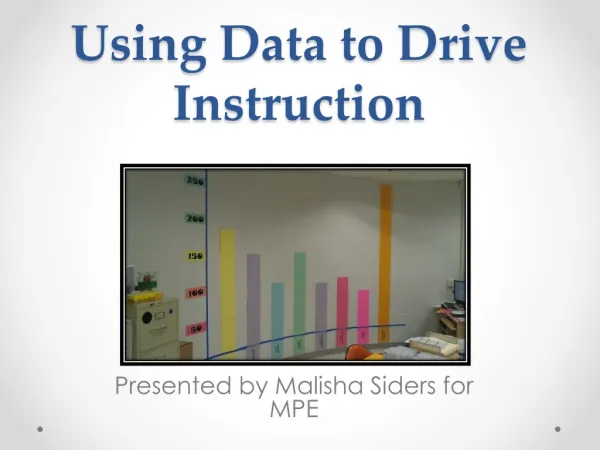
Next Steps • Based on the data and measurable objective, the next step is to differentiate instruction so that students at academic different levels or of different abilities, interest or learning needs experience equally appropriate ways to absorb, use, develop and present concepts as a part of the daily learning process.
Ways to Differentiate Instruction • Tiered by Process and Readiness • Tiered by Process and Learning Style • Tiered by Process and Student Interests
Universal Steps • Setting Expectations for Learning • Activating Prior Knowledge • Acquiring Vocabulary, Skills, Concepts, Data, and other Content • Practicing with Content • Applying Content • Reporting Results
By Process and Learning style • As you design your activities below, include multiple presentation modes, select and adapt strategies to align with the learning styles of your students, and create opportunities for students to apply their strongest learning style. For example, use a combination of learning styles in your whole class teaching and allow students to join small groups tiered by learning styles to carry out and report the results of assignments.
By Process and Student Interests • As you design your activities use learning centers, interest groups, expert groups, simulations, or jigsaw groups to support and accommodate student interests. For example, if you differentiated your real world setting for student interests, you might establish an expert group for each student interest group.
By Process and Readiness • As you design your activities, use appropriate reading materials, tier assignments, target instruction in small groups, provide online activities, and match difficulty levels with student skills so they are not too hard nor too easy. For example, the following lesson has differentiated performances for basic, proficient, and advanced student readiness levels.
Sample Mathematics Lesson Differentiated for Student Readiness
1. Setting Expectations • Basic Introduction: A circle graph is used to show the relationship of parts to a whole and to each other. Each graph is shaped like a pie. Each slice of the pie represents a fraction/part of a whole. Today you will organize and show information in a circle graph. • Proficient Introduction: A circle graph is used to show the relationship of parts to a whole and to each other. Each pie-shaped wedge represents a fractional part of a whole. Today you will organize and display data in a circle graph. • Advanced Introduction: A circle graph is used to show the relationship of parts to a whole and to each other. Each pie-shaped wedge represents a fractional part of a whole. Today you will organize and display data in a circle graph.
Real World Setting • Today you will work with your team to interview one classmate to find out how they spend a typical school day. For example, Kristen's day goes as follows: 8.5 hours of sleep, 1.5 hours eating, 2 hours homework, 2 hours volleyball practice, 6.5 hours in school, 1 hour miscellaneous activities, and 2.5 hours for friends and family. You will then use that information to create a circle graph. Here are your instructions: • 1. First you will use the attached sheet to interview your classmate about how they spend their day. • 2. Then you will set up a table, giving to each category the fractional part of a whole each category represents (24 hours in a day), and the number of degrees of each category found, by multiplying the fractional part by 360. The sum of the parts should add up to 360 degrees.3. Next, draw a large circle with the compass (or with a pattern). Locate the centerof the circle.4. Use a protractor to draw central angles, with the number of degreesrepresenting each category.5. Label each wedge, or color them and show the legend for the colors.6. Give the circle graph a title.
How do you spend your day? Name:_______________________________ Date:______________________
Basic: First, let’s practice by finding out how you spend your day. Complete the chart below. When you are done, go to the computer station to this website to help you build your graph. My Circle Graph
Proficient: Complete the chart to show how you spend your day. Set up a table to show the findings Go to this website when you are done to create and check your numbers. Graphing
Advanced: Think about all of the things you do in a day.Set up a table to show the findings. Draw the circle graph with angles representing the number of degrees from the table. Use this video to refresh your graphing skills: How to make a circle graphThen create a graph at the website below to check your angles. Graphing
2. Activating Prior Knowledge • Basic: Give each student a KWL chart. Then ask students, what is a circle graph? How is information displayed? Students will share their results with the group and the teacher will record results on chart paper. • Proficient: Give each student a KWL chart. Then ask students, what is a circle graph? What kind of information does it show? Students will share with their partner in a think-pair-share activity. • Advanced: Give each student a KWL chart. Then ask students, what is a circle graph? What kind of information does it show? Why is it useful? Students will work in groups to create knowledge charts.
3. Acquiring Vocabulary, Skills, Concepts, Data, and other Content • Basic: Give each student a flashcard book with vocabulary words already written on each card. They can record notes and meanings. In addition, record new vocabulary with matching picture on the word wall and practice creating simple circle graphs. • Proficient: Allow student to record new vocabulary in their notebooks. In addition, the teacher will record new vocabulary on the word wall and practice creating simple circle graphs. • Advanced: Allow student to record new vocabulary in their notebooks. In addition, the teacher will record new vocabulary on the word wall and practice creating simple circle graphs.
Use formative assessment to check progress and make adjustments • Basic: Create a circle graph as a whole group. Ask students to vote on their favorite Saturday activity (skating, reading, watching tv, playing games, etc). Teacher will chart answers in a table on the board. Students will identify the data needed to be input into the graph and how the graph should be created. Students will be encouraged to ask questions and reflect on each part of the process. • Proficient/Advanced: Review data for a circle graph as a whole group. Students will then be given a circle graph to input the data based on the results from the class question, What is your favorite Saturday activity? Students will be encouraged to ask questions and reflect on each part of the process.
4. Practicing with Content • Basic: Engage the students by asking them to pretend they are reporters for the school newspaper. They will be interviewing students at our school (their classmates) about their school day. it is their job to find out how most kids in 8th grade spend their day. They will be collecting the data that the journalist needs to write the report.
Proficient: Tell the students that they are the journalists for the school newspaper and it is their job to take the data that the interviewers give them and report it accurately.
Advanced: Engage these students by informing them that they are the editors of the newspaper. As editors, they review the information from the interviewers and journalists to make sure that the data has been represented clearly and accurately before being published.
To practice with content in their real world setting roles: • Students will be organized into groups of three. Students at basic level will be given the graphic organizer/interview sheet to begin the survey. Proficient and advanced students will begin gathering the materials needed to create the circle graph.
5. Applying Content • Basic:As interviewers, I would allow the students to ask alternative questions if there is no data to collect for a specific question or if the question does not apply to a student. • Proficient:I would encourage the "journalists" to use various methods of calculating, double-check their answers, and seek assistance from classmates. In addition, I would have them to review information charts and their notebooks to clarify questions or problems. • Advanced:I would encourage the "editors" to use re-check calculations and seek assistance from classmates.
Formative assessment to check progress • Basic: Muddiest Point activity: students write one or two ideas that were least clear to them from the lesson. • Proficient: One Minute Note activity: students identify the most significant (useful, meaningful, disturbing, etc.) things they learned. • Advanced:Application Card Activity: students will write down at least one real-world application for what they have just learned.
Students will be given an "exit ticket" – small pieces of paper designed to look like tickets, but with space for writing. I will ask students two questions. One that requires a factual answer about the big idea of today’s lesson, but in their own words. A second question would require more explanation of a concept. Basic students can also illustrate what they have learned. Basic: Have each student complete a concept map and work with the teacher to explain any content that they did not understand. Proficient: Have each student work with a partner to complete a concept map and share ideas/questions with one another about the content. Advanced: Have each student complete a concept map to show what they have learned. 6. Reporting Results
Please use the google group to share your thoughts, suggestions, etc about this demo. Thanks!