Download
1 / 13
130 likes | 134 Vues
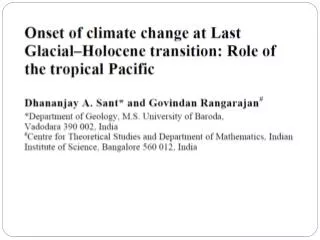
stable. transition. stable. We concentrate on the transition from one distinct stable phase of the climate (the glacial phase) to another stable phase (Holocene). 18.8. 16.2. 15.7.

E N D
stable transition stable We concentrate on the transition from one distinct stable phase of the climate (the glacial phase) to another stable phase (Holocene). 18.8 16.2 15.7 From the above observations, we see that the warming started first in the tropics, then propagated to the Antarctic and finally to the Arctic. 14.7 We begin our analysis with the warming in the tropics. Holocene
We first explore the role played by the tropical Pacific Luochuan [35°45N, 109°25E] At 21.3 ka BP, QMD falls sharply. Quartz Median Diameter (QMD) continuously increased during the glacial phase. QMD is a proxy for wind strength and the decline in QMD suggests atmospheric change. Marine core [20°07N, 117°23E] located in the South China Sea recorded the change in wind patterns at 20ka BP. → This shows that the change has propagated from Chinese loess plateau to South China Sea by 20 ka BP.
The orbital forcing and the consequent changes in insolation patterns would have triggered the warming of tropical Pacific. • This warming up of the Pacific generates a jet stream over the Chinese subcontinent. • Blown the sediments from the western desert and deposit them in China(21.3ka BP) → South China Sea(20 ka BP). • The warming of the tropical Pacific would have led to an increase in production of water vapour (a significant greenhouse gas) over the tropics.
The release of CH4 from methane hydrates deposited in marine sediments during the glacial phase. • The greenhouse gases feedback cycle proposed above has led to a warming trend recorded in the Tibetan plateau (at the Guliya ice-core) starting from 18.8 ka BP. 19 ka BP
Heat from the tropical Pacific is transported to both hemispheres but with a significant bias towards the south. • This mechanism causes the observed initial change in Antarctica at around 16 ka BP. • Great ‘conveyor belt’ circulation of the Atlantic Ocean, which carries warm surface-water north and cold, dense, deep-water south, would have led to a warming of the Andes ice-cores followed by the Greenland ice cores.
A Difference between the last glacial–Holocene transition and Younger Dryas • A characteristic feature of the transition is that the change is first observed in CH4 records at the ice cores, whereas the change in δ18O follows later with a lag. This is in contrast to what happens during events like Younger Dryas.
Now and the future • The CH4 records from polar ice cores show a significant increase starting at around 3 ka BP, whereas there is no corresponding increase (yet) in the δ18O records from these ice cores. • The only exception is the δ18O record at Guliya, which indicates the commencement of a warming trend starting at around 3 ka BP. • This is again similar to the situation during the transition, where the Guliya core records the change first.
~240,000 years before the present Because of uncertainty in the gas age–ice age difference, we have measured the isotopic composition of argon in air bubbles in the Vostok core during Termination III The sequence of events during Termination III suggests that the CO2 increase lagged Antarctic deglacial warming by 800 ± 200 years and preceded the Northern Hemisphere deglaciation.
From 2815 to 2775 m increased 25% From 2775 to 2745 m decrease
40Ar (assumed to be a proxy of Vostok temperature) 2810m 150ppbv • Assume there is no lag of 40Ar behind temperature and so they must be considered tentative. • We follow Petit et al. in assuming that CH4 can be used as a time marker of the glacial-interglacial warming in the Northern Hemisphere. First maximum ~6000 yr
The best correlation (R2 = 0.88) was obtained when we shifted the CO2 profile by 800±100 years. (consider uncertainty) → 800±200 years This confirms that CO2 is not the forcing that initially drives the climatic system during a deglaciation.
Deglaciation is probably initiated by some insolation forcing, which influences first the temperature change in Antarctica (and possibly in part of the Southern Hemisphere) and then the CO2. • CO2 plays a key role in amplifying the initial orbital forcing. • CO2 may be controlled in large part by the climate of the southern ocean. • Indeed, it is not clear whether the link between the southern ocean climate and CO2 is the result of a physical mechanism, such as a change in the vertical ocean mixing or sea-ice cover changes, or a biological mechanism, such as atmospheric dust flux and ocean productivity. • Deep ocean, as its mixing time is close to the observed 800-year lag.