Download
1 / 4
40 likes | 45 Vues
Sup. Fig. 1. Sample set #1 WT mice (n = 3). Sample set #2 WT mice (n = 3). Sample set #3 WT mice (n = 3). Histology LCM of microbes DNA extraction. Histology LCM of microbes DNA extraction. Histology LCM of microbes DNA extraction. Pyrosequencing analysis

E N D
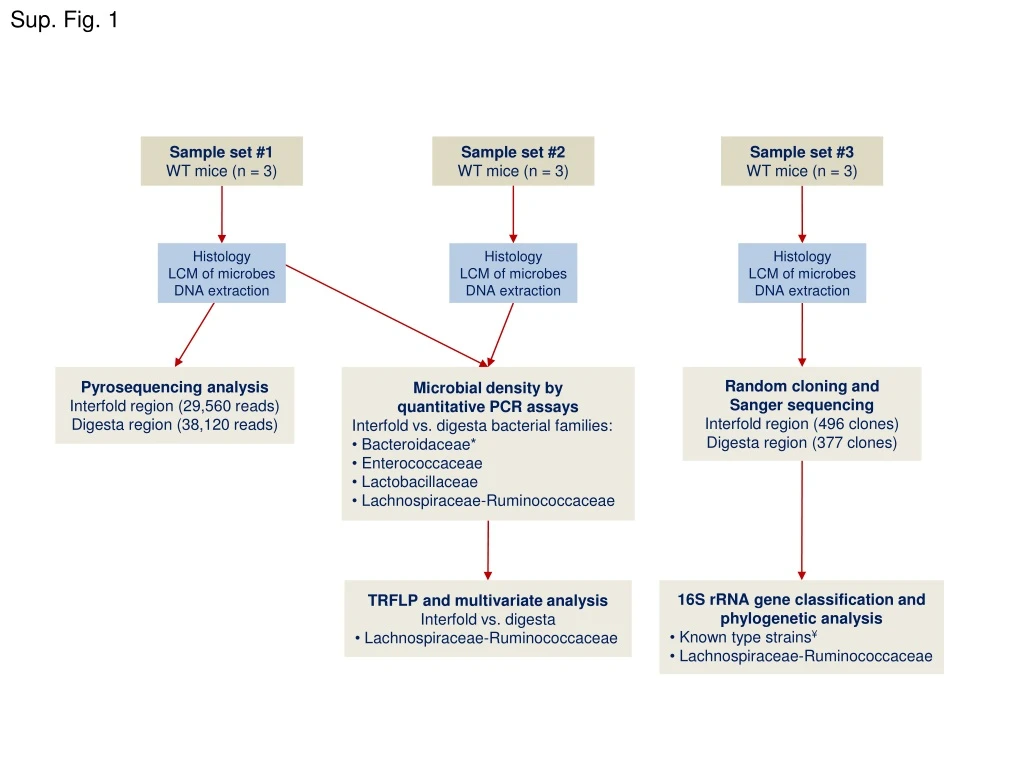
Sup. Fig. 1 Sample set #1 WT mice (n = 3) Sample set #2 WT mice (n = 3) Sample set #3 WT mice (n = 3) Histology LCM of microbes DNA extraction Histology LCM of microbes DNA extraction Histology LCM of microbes DNA extraction Pyrosequencing analysis Interfold region (29,560 reads) Digesta region (38,120 reads) • Microbial density by • quantitative PCR assays • Interfold vs. digesta bacterial families: • Bacteroidaceae* • Enterococcaceae • Lactobacillaceae • Lachnospiraceae-Ruminococcaceae Random cloning and Sanger sequencing Interfold region (496 clones) Digesta region (377 clones) • TRFLP and multivariate analysis • Interfold vs. digesta • Lachnospiraceae-Ruminococcaceae • 16S rRNA gene classification and phylogenetic analysis • Known type strains¥ • Lachnospiraceae-Ruminococcaceae
Sup. Fig. 2 A B
Sup. Fig. 3 A B C
Sup. Fig. 4 Interfold Digesta 97% 97% 95% 95% Number of OTUs observed 90% 90% 80% 80% Number of sequences