Download
1 / 49
490 likes | 500 Vues
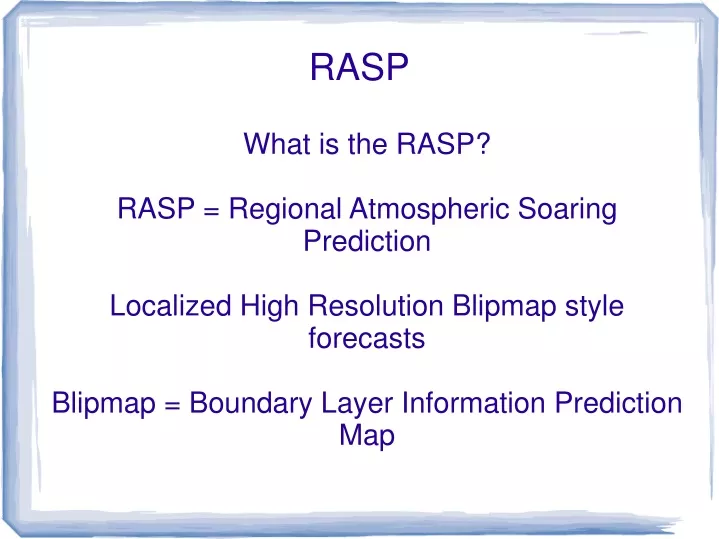
RASP. What is the RASP? RASP = Regional Atmospheric Soaring Prediction Localized High Resolution Blipmap style forecasts Blipmap = Boundary Layer Information Prediction Map. The developer of both “Blipmaps” and the RASP: Dr. John Glendening , alias “ Dr. Jack ”.

E N D
RASP What is the RASP? RASP = Regional Atmospheric Soaring Prediction Localized High Resolution Blipmap style forecasts Blipmap = Boundary Layer Information Prediction Map
The developer of both “Blipmaps” and the RASP: Dr. John Glendening, alias “Dr. Jack”. Research Meteorologist with Naval Research Lab in Monterey. Specializing in “Boundary Layer Meteorology” - studying the turbulent atmospheric layer created by thermals and other surface-based eddies. Glider Pilot
Blipmaps look like the following slide, which gives the height of expected thermals for the California/Nevada region. Blipmaps plot data from the RAP and NAM computer models. Other Blipmap “parameters” available as this kind of blipmap plot include: Thermal Strength Bouyancy/Shear Ratio – whether wind shear will be strong enough to “disrupt thermal structure” B/L Convergence. The presence or absence of cumulus clouds. Cloudbase of cumulus clouds, if present. “Over-development” - overcast, thunderstorms Surface Temperature. Surface Winds.
RASP uses another computer model called the WRF- “Weather Research and Forecasting Model”, that is set up to run physics related “equations of motion” on a Linux computer. These are complex “partial differential” equations. The WRF was developed by the NOAA, but is owned and was paid for by you, the taxpayer, and is available to the public. The “sourcecode” is written in FORTRAN. Dr. Jack compiled the sourcecode to run on the free operating system called “LINUX”, an open source version of UNIX. The WRF model of the RASP is “initialized” by taking output data from other government computer models. In the U.S., we use the ETA, a variant of the NAM to initiate it, in Europe, they use the GFS model. Other models can be used by some skilled operators, such as the ECMWF. An individual operator has to set up a “Domain” to define the region of interest, and set the desired “grid resolution”, among other things.
Generally, the different computer models used to initiate the RASP can store their output for historical purposes, or it can be used to “initiate” other computer model runs. One model can be initiated with output data from another model. This is done by using a common binary data file format called a “GRIB” (Gridded Binary) file. The government publishes GRIB files for all the computer models it runs on publicly accessible FTP and web sites at regular intervals within a short time of their production. The RASP initiates with GRIB file data from the ETA, and runs a forward prediction using the WRF model.
The output from the WRF model is saved. The RASP then uses a government plotting language called “NCL” (NCAR command language) to generate the various “blipmaps”. Dr. Jack developed some of his own computer code to develop useful custom “parameters” for glider pilots from the WRF output, and his own NCL code to plot the associated blipmaps.
Ten reasons to use a BLIPMAP • Easily interpreted, requiring little meteorological background • Relevant predictions, what a soaring pilot really wants to know • Supplies information not available on meteorological weather sites • Quickly evaluated using its graphical presentation map • Covers an entire region, including elevated terrain • Has been verified by actual pilot experience • Available on the evening prior to the flight • Uses the latest meteorological observations, updated through the night • To anticipate route legs having more difficult conditions and how the soaring day will begin and end • To avoid missing a great soaring day
NAM “North American Mesoscale” Used for older Dr. Jack Blipmaps Forecasts out to 84 hours Available only for two hours each day Updated at 6 hr intervals For same forecast period, NAM available ~1hr later 12 km horizontal resolution Poorer vertical BL resolution
RAP - “Rapid Refresh” Used for older Dr. Jack Blipmaps Forecasts out to 12 hours Available for five hours through day Updated at 3 hr intervals For same forecast period, RAP available ~1hr earlier 20 km horizontal resolution Better vertical BL resolution
RASP is a higher resolution, more localized version of the NAM and RAP Blipmaps, that Dr. Jack had already been giving us (and still is!). RASP is set up at a resolution of typically 4km vs 12 km of the NAM, and 20Km of the RAP. The computing power required to do this higher grid res. for a large area of the CONUS exceeds what is available to personal, or even NOAA computers. Doubling the grid resolution of a model requires eight times the computing time. Therefore, Dr. Jack came up with the idea of “farming out” or distributing the job of running local RASPs for popular soaring locations to individual enthusiasts to do on their own machines - similar to the “SETI” project.
Whereas the "DrJack" RAP and NAM BLIPMAP soaring forecasts available in the U.S. are obtained by post-processing files output by the "equations of motion" meteorological models run by the U.S. Weather Bureau, RASP BLIPMAPs are obtained by independently running an "equations of motion" model by a soaring-weather enthusiast who has installed the freely-available RASP program on their local PC. This independent run has many advantages over reliance on government-run models:
RASP forecast grids allow higher resolution than provided by government models. The full influence of topographic features can be ascertained. RASP provides full control over output times, plotting, area covered, etc. This allows operators to specifically tailor forecasts for their local region. RASP BLIPMAP plots provide soaring-specific thermal forecasts, the parameters soaring pilots want to know, which government forecasts do not. RASP predicts mountain wave updrafts, which government forecasts cannot (this requires high resolution, 1-6km, so wave bars are resolved).
RASP forecasts can go out to +2 days, or longer, depending on which model is used to initiate the WRF RASP runs. RASP can go out 84 hours if initiated by the NAM, or up to 10 days with a GFS initiated run. Dr. Jack feels that runs going out more than +2 days are not accurate enough to be of much use.
RASP operators have to set up their own individual websites in order to display their forecasts for mass consumption. You will not see a lot of uniformity amongst most RASP sites in terms of the web based user interface, although Dr. Jack does supply a basic web user interface model with his RASP Linux installation kit. A long flight along the convergence, such as from Hollister to the Mexican border, would cover several individual RASP domains, often with each one having a different style web user interface, making it somewhat more inconvenient to use for planning a very long flight.
RASPs only cover areas of the world where an individual enthusiast/operator has chosen to take on the task. The West coast, including N. California, S. California, Nevada, parts of Arizona, Oregon and Washington, the Front Range area of Colorado are well represented, as is Hawaii. The East coast, centered around the northern and central Allegheny Mts., is covered pretty well, but there are many other popular soaring areas that are not covered by RASP at all at the present time.
Examples of RASP in use. Saturday, Aug 9, 2014 was a good soaring day. I thought I would show some RASP related weather forecast related stuff that may help explain what was going on, and also help newer soaring pilots see an approach you can use yourself to get an idea what the soaring weather may be like - either the night before you come out, or early the in the morning on the day you are going to fly. I have links to these things and more on the "Sierra RASP" site at: http://canv.raspmaps.com/RASP/SIERRA/FCST/RASPtable.html
The RASP is a small scale, detailed forecast for a rather localized area. Before going to the RASP, you should always try to get the “big picture” or the “synoptic scale” weather picture. You can get this from looking at more generalized, larger scale weather forecasts, on television, or from the NWS at http://nws.noaa.gov. Remember, the RASP sites are not official weather briefing sites for purposes of satisfying the FAR requirement for a preflight weather briefing (mainly because they do not include things like TFRs, NOTAMS, AIRMETS, SIGMETS etc.), but they can be helpful for monitoring the weather for possible soaring on an upcoming available weekend, up to a few days ahead.
The NWS “Forecast Discussion” for the region, combined with the GFS computer model forecast plots for the 500 mb heights and "vorticity", which also depicts the "Steering Winds" at about 18,000ft., will give you a good idea of the overall larger scale "Synoptic" picture. In other words, what the larger size air mass movements and pressure center changes are doing that will be affecting the weather in our region. The RASP soaring forecast, which we all like to look at, does not show you this larger scale synoptic level picture, although the RASP is highly affected by the synoptic level situation. So, you should start by getting the overall synoptic level picture in your mind first, then go to the RASP. You'll get more out of it.
Satellite Images are helpful for visualizing the synoptic picture described in the forecast discussion, particularly water vapor images, which the professional forecasters seem to use a lot, along with the computer model forecasts, such as the GFS (Global Forecast System), the NAM and the ECMWF. Recently a new model called the HRRR became available. The GFS usually works pretty well, and most of the time the computer models tend to agree, but occasionally they do not. The forecasters will often comment on these computer models in the forecast discussions, so it's fun to try to become familiar with what they're talking about.
Once you get the "big picture" from the synopsis, it's time to start looking at the RASP. These plots are from Bart's Avenal RASP. The Boundary Layer Top plot shows you the highest level the thermals are expected to go. This one is for 1400 PST, or 1500 PDT. The BL Top usually can not be reached by the average Joe glider pilot in a 2-33, I won't mention any names. However, I often find that if I ask the top pilots in their glass and carbon fiber ships how high they got on a given day, again, I won't mention any names, they very often reach almost exactly what the maximum BL Top forecast is on the RASP. For orientation, Avenal is No. 1 on the map, and Coalinga is No. 2.
Winds combined with the effects of terrain, have a strong association with areas of "convergence", which is generally very desirable, as it is associated with stronger lift and lift that is lined up that can be "run" to cover a lot of ground with less need for stopping to circle. Strong winds tend to break thermals up into bubbles and disorganized turbulence, and are generally considered a negative for thermal soaring. Lighter winds are more favorable to thermals in general. Winds also very important if you are considering using ridge lift and avoiding sink associated with wind blowing downslope. They are also very important along with terrain in wave formation.
The next plot is what Dr. Jack, the inventor of the RASP calls "BL Max Up/Down Motion". That is "Dr. Jack speak" for what most of us now call "Convergence". In the old days we used to call this same thing a "shear line". You will hear those last two terms frequently around glider pilots. You will not likely hear "BL Max. Up/Down Motion", unless maybe Dr. Jack is visiting! Values above zero are good, and indicate lift from convergence. In all Dr. Jack's plots, warmer colors tend to be stronger or often "good", and cool colors tend to be lower values and often "bad". The exception may be winds, where warmer colors indicate stronger winds, which is usually bad for thermal soaring, but may be good for wave soaring.
You can see an interesting phenomenon related to the convergence line in the next plot. If you look south of Avenal, where the Cottonwood pass allows marine air to spill through the mountains, you can see the yellow colored convergence line bowing out to the East towards the central valley, probably East beyond I-5. This happens pretty frequently. So if you are coming back from the south towards Avenal, you may have to detour out to the East from the straight line course back to Avenal in order to say in the convergence line.
The area to the West of the bowed out area will likely be marine air, that is more stable and likely to be devoid of thermal lift. The wind to the West of the convergence line will tend to be stronger out of the West, especially East of Cottonwood pass, or other low points in the Diablo and Temblor ranges. If you look further North, up by the Pacheco Pass area, you will see an even more pronounced bulging of the convergence to the East. It bulges out East to the point where it appears the convergence line is completely “blown out”, or disrupted to the East. This correlates with the much stronger winds coming through the Pacheco Pass compared to the Cottonwood Pass at this time.
The next plot shows Thermal updraft velocity plotted along with what is called, in what I call “Dr. Jack Speak”, the "Buoyancy Shear Ratio". In more plain English, what this tries to show is whether wind will be so strong as to cause the thermals to be broken up into bubbles or turbulence, that is difficult for soaring pilots to use (bad). Or, looking at it the other way, whether the wind will not be strong enough to to the same (good). If you see areas that appear stippled, expect that the wind will be strong enough to cause the thermals to be "broken up" or changed into difficult to use bubbles and turbulence rather, than nice steady chimney-like columns of rising air.
Another very useful plot is the "Cu Cloudbase where Cu Potential > 0". Don't be put off by the Dr. Jack speak title. This is one of the most useful of the RASP blipmaps. What it basically shows is if there will be cumulus or not, and if there are cumulus clouds, what will be the altitude of the cloud base. You can see from this plot that it was clear over the Avenal area, but to the South around the New Cuyama area, there were forecast to be cumulus with a cloudbase of approximately 10,500 MSL. Morgan and Julie were considering making a run towards these clouds, which Morgan discussed on the SoarAvenal Blog for this date.
This is a Skew-T/LogP sounding forecast for Avenal at 1400 PST. Weather balloons are sent aloft at certain locations, directly measuring the temperature, dew points, and winds at altitude, radioing values back to the NWS, which plots them on the same Skew-T/LogP graphs. This Skew-T plot produced by the RASP is a FORECAST of what such a balloon would measure IF you were to release one at this time of day. You can extract much useful information from these Skew-T forecasts, once you learn how to read them. They can show high level clouds, such as cirrus clouds, which do not show on any of the other RASP plots, but which can affect the heating at the surface and the accuracy of the RASP forecasts.
If there is likely to be precipitation, it will also show in these RASP Skew-T plots. This particular Skew-T plot however, does not show any high level clouds or precipitation. It also does not indicate that there will be any cumulus clouds or over-development type of clouds, such as overcast or thunderstorms. In other words, it is saying the sky will be clear, which it was!
Below is another RASP Skew-T sounding forecast for the same date and time as above, but for the Mt. Whitney area, where there were some cumulus build ups and some “over development”. You can see how, when there are cumulus, the temperature and dewpoint lines will tend to merge at the altitude where the cloudbase is forecast. You can also see a black box-like area on the left side, and inside that, a small green line. The black box area indicates the altitude and thickness of the cloud layer. The green line area indicates there could be precipitation. Precipitation may not reach the ground. Or, it could be in the form of snow, if the conditions are right.
The RASP can show waves. In the following slide, you can see a primary wave being predicted on the lee side of the Sierra Nevada range on the sample Vertical Velocity at 500mb plot. On this forecast, you do not see any secondary waves but sometimes they are predicted, and will show as multiple “wave bars” downwind of the mountain generating the wave. The blue color indicates sink and the reddish colors indicate lift.
The Vertical Velocity at Vertical Velocity Max plot will give you a cross sectional depiction of the wave along a line in a direction where the computer model calculates the maximum wind in the forecast area. It is also possible to select a fixed point on the surface, and have a cross sectional plot like this made in a desired direction regardless of the wind strength and direction. I do not have a good example of that to show you, but Bart has that type of plot set up for Black Mtn. In the Diablo range near Avenal on his Avenal RASP.
The future beyond the RASP Recently the government has officially launched a new computer model called the HRRR, for “High Resolution Rapid Refresh”. This model is run for the entire CONUS at a 3km resolution, which is actually higher res. than most typical 4km res. RASP set ups. It displays quite a few plots that are very similar to RASP plots, such as surface temperature, winds etc. It displays certain other things the RASP does not even know about, such as predictions of RADAR plots, including ECHO tops. Some RASP-like information, such as wave activity, can be gleaned from it. It has nothing like the Cu Cloudbase where Cu Pot. > 0. It only goes out 15 hours, which is a pretty big disadvantage.
Ultra High Resolution RASP The RASP is capable of running at very high resolutions, which can resolve atmospheric events with a sometimes astounding degree of accuracy. It does require an exponential increase in computer power to run at these very high resolutions. For example, during the 2013 World Soaring Championships at Uvalde, there was one day where a “Mesoscale Convective Complex” was forecast by standard techniques to occur to the North of Uvalde over the higher plateau in that direction. The tasks were therefore called such that the competitors were sent on tasks to the South, in order to avoid this area.
However, late in the day, as the competitors were making their way back to the NW on the last leg of their tasks, a very large outflow boundary had poured out of the mesoscale complex to the North and spread out to the South, accompanied by cold stable air, high winds and blowing dust. Gliders that managed to finish before the rather sharply defined outflow boundary arrived at Uvalde were safe, However, many gliders, only a little bit later, encountered the cold stable air, precipitation, and strong headwinds behind the outflow boundary, and were unable to get back to Uvalde. There was a mass land out, with gliders scattered over miles of country side to the SE of Uvalde that afternoon.
There was a RASP enthusiast named Elmer Joandi in Europe, who was running his own very high resolution .7km grid resolution RASP domain for the UVALDE contest area that day. He had predicted the arrival and timing, within less than one hour, of the arrival of the outflow boundary from the mesoscale convective complex at the Uvalde airport. He was not publicizing the fact that his RASP was running, except to a small group of RASP enthusiasts on Dr. Jack's RASP discussion group. He has a very powerful computer system available to him in order to have set up a RASP domain to run at the ultra high resolution he was using.
Radiometrics Corporation installed an MP-3000A microwave radiometer at Garner Field in Uvalde, Texas, to support the World Gliding Championships. Data from the radiometer provided pilots and event planners real-time radiosonde equivalent atmospheric soundings and forecast indices. Radiometrics' Mike Exner, an experienced glider pilot, explained: “Without the radiometer data, weather forecasters for the championships would rely on soundings from the 7AM and 7PM (local) radiosonde launches from Del Rio, 70 miles to the west. The MP-3000A will provide temperature and humidity profiles up to 10 km that are equivalent to radiosondes, but updated every three minutes, rather than only twice-daily.
Real Time, Inflight Weather Information with ground based support 2014, Gordon Bettger and Hugh Bennet, DuoDiscus, take off at Minden, NV. Using wave lift at several points along their route, they reach Wyoming. Used an inflight network based means of communication with ground support by Weather Forecaster Walt Rogers, who many of you have met at our CCSC spring contest. Walt was able to use the HRRR to give them information about making course corrections to find wave along their route. Getting real time inflight information like this in contests was always prohibited in contest flying, but recently, contest officials have decided to no longer ban receiving this type of information inflight.