Download
1 / 34
340 likes | 351 Vues
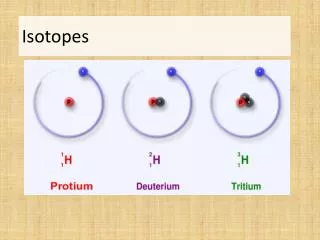
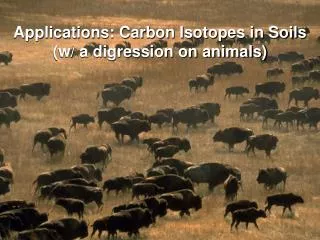
Nitrogen Isotopes in Animals: Systematics. http://www.zuropak.com/photogallery/2008-favourites/slides/Yellow-rumped-Warbler-214.html. Timothy Lambert (adapted from 2007 presenter) Earth 229, Winter 2010. Roadmap. Why are animals enriched in 15 N? Physiology Model

E N D
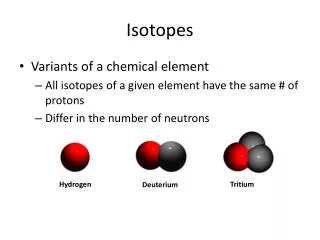
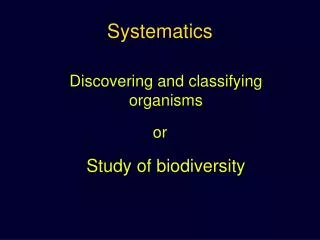
Nitrogen Isotopes in Animals: Systematics http://www.zuropak.com/photogallery/2008-favourites/slides/Yellow-rumped-Warbler-214.html Timothy Lambert (adapted from 2007 presenter) Earth 229, Winter 2010
Roadmap • Why are animals enriched in 15N? • Physiology • Model What causes variability in this discrimination? • Dietary protein • Environmental controls • Growth vs. catabolism
Enzymes break dietary protein into amino acids. N Cycle(human) • protein turnover • Some proteins turnover faster than others • amino acid pool • throughout body • significant mixing
N Cycle(human) Amino acid pool Fate #1: Body protein Fate #2: Metabolized -N excreted as ammonia/urea -C skeleton converted to fat/glucose
Nitrogen excretion • Ammonia NH3 • Simplest form, but toxic • Bony fish, amphibian larvae • Urea (NH2)2CO • More complex but still toxic • Mammals, some herps (frogs), cartilagenous fish • Uric Acid C5H4N4O3 • Least toxic • Birds, insects Water efficiency
Moving N in the body: Transamination α-keto acids Amino acids Transfer of amine group http://molbio.med.miami.edu/Medical/Werner/Pdf-Files/MBL%2039.pdf
in liver or kidney Deamination First transfer amine group to carrier Ketoglutarate → Glutamate Deamination fractionates N! Ammonia product is depleted in 15N. Then deaminate Glutamate to produce ammonia
The Urea Cycle • Requires CO2, NH3, and • aspartate • Glutamate = source of NH3 and • aspartate • Glutamate fractionates N • (14N is preferentially reacted)
-6 per mil Urea (depleted in 15N) Diet Body (enriched in 15N) Hair, milk, feces… N in the BodyKinetic Fractionation, Open System Animals are enriched in 15N relative to diet because urea is depleted in 15N relative to body.
Llama Study (Sponheimer et al. 2003) Diet = Excretion Products • No significant depletion of waste products relative to diet • Claimed it contradicted theory of enrichment due to depleted 15N in urea • Explanations? • Urea is not urine (contains creatinine, etc.) • High protein diet • In equilibrium, inputs = summer outputs (always!) • Body tissue is elevated relative to diet, urea is depleted relative to body. Pretty llama pictures
Trophic Ecology ~3 per mil for every trophic level
Amino Acids in Trophic Ecology Martinez del Rio et al. 2009 • Bimodal 15N distribution • Source amino acids • (essential) • Trophic amino acids • (nonessential)
Trophic Ecology But lots of variation. Why?
What causes variability in N isotope fractionation? 1. Protein in the Diet Low vs. high protein Herbivore vs. carnivore ↑ quality decreases fractionation ↑ quantity increases fractionation Koch 2007
Effects of elemental composition on the incorporation of dietary nitrogen and carbon isotopic signatures in an omnivorous songbird. (Pearson et al., 2003) • High vs. low protein diets • Food: Bananas and insects in varying proportions • Sampling of mass, blood, feathers Yellow-rumped warbler
Diets: %Insect, Isotopes, & Concentrations Attempted to create diets along a linear continuum of increasing a) isotopic signature (didn’t quite work for 15N) b) elemental concentration by increasing the % insect protein in diet
Diets: %Insect, Isotopes, & Concentrations Only 0.12‰ difference in δ15N values among diets. Diet containing most insects did not have highest δ15Nvalue (diet with lowest proportion of insects did not have the lowest δ15N value)
Turnover Rates: Half-life Plasma & Blood Half-life estimates plasma: δ13C 0.4-0.7 days δ15N: 0.5-1.7 days Half-life whole blood: δ13C~4-6 days (diet 1=33 days!) δ15N 7.45-27.7 days Whole blood is variable!
Discrimination:Plasma, Feather, and Blood 15N values plasma & whole blood enriched 1.7 to 3.0‰ “Apparent” fractionation factor for feathers 15Nenriched (3.2-3.6‰) Fractionation factors increased linearly with elemental concentration in diet for N
in ↑ %N ↑ tissue δ15N out ↑ uric acid w/ ↑14N
High Protein = Large Fractionation Due to larger loss of 15N-depleted urea Results Diet: Linear relationship between elemental concentration and fractionation factor. 2. Tissue: Discrimination and turnover rates vary. Solution: Concentration dependent, multi-compartment mixing models %N in diet
What causes variability in N isotope fractionation? High vs. low protein diets Water availability? Correlation between bone collagen 15N and aridity
Why does ↓ Water availability↑δ15N in Animal Tissue? 1. Diet/plant δ15N increases in arid habitats • ↑ aridity = larger relative 14N-rich gas loss (soil denitrification) 2. Metabolic enrichment theories • ↑ urine excreted is isotopically heavy (rich in δ15N) (Ambrose & DeNiro 1986, Sealy 1987) • ↓ protein diets in arid regions promote urea recycling for N
Kangaroo metabolism does not cause the relationship between bone collagen δ15N and water availability(Murphy & Bowman, 2006) Motivating question: Can ↑δ15N be explained by herbivore diet alone?
Methods Big study! • 779 road killed roos • 15N, 13C of bone collagen • Macropus spp, grazers, small ranges • 173 grass collections • 3-4 primary spp at each site, 15N • Water Availability Index
= data +
Results 4.74‰ to 4.79 ‰ enrichment
Q: Can dietary C3:C4 explain the δ15N vs. water availability trend? What about C3 vs C4 grasses? • δ13C of bone collagen as proxy • Negative and weak relationship • Lower δ15N in C4 plants (1.1‰) C4 C3 • Both C3 and C4 plants show decreased δ15N with increased water availability. C3 C4 A: No! Can’t explain isotope trend by differences in C3:C4.
Summary • Strong negative relationship of herbivore δ15N bone collagen and water availability. • Near identical negative pattern of δ15N in grass and kangaroo bone collagen with water availability • Plant δ15N is main cause, with no change in metabolism • Huge support for historic trophic ecology and past climate change data that rely on direct relationship between herbivores and plants which not confounded by animal metabolism
What causes variability in N isotope fractionation? • High vs. low protein diets • No aridity effects (but understand environmental effects on 15N of the food chain’s base!) • Starvation! Growth vs. catabolism
Body Urea 6‰ Body Mass Lost Kinetic Fractionation, Closed System Nitrogen Balance: Starvation • Generalization: Starvation • increases 15N of tissue. -6 per mil Urea (depleted in 15N) Diet Body (enriched in 15N) Hair, milk, feces… • Inconsistent results • (Martinez del Rio et al.) • Assumes well-mixed pool • Reality: tissues vary in growth • Some continue protein synthesis (e.g. splanchnic • organs, liver), others shut off (e.g. muscle) • Solution: Multiple compartments
Body Urea 6‰ Body Mass Lost Kinetic Fractionation, Closed System Nitrogen Balance: Starvation • Generalization: Starvation • increases 15N of tissue. • Inconsistent results • (Martinez del Rio et al.) • Assumes well-mixed pool • Reality: tissues vary in growth • Amino acid pool becomes enriched; • Some tissues continue protein synthesis (e.g. • liver), others shut off (e.g. muscle) • Solution: Multiple compartments
Summary • Animals retain 15N, excreting 14N preferentially (~6‰) • Useful in trophic ecology • Differences between source and trophic amino acids • Discrimination affected by: • Protein quality and quantity • Aridity affects food chain, not physiology • Starvation increases δ15N