Download

1 / 11
110 likes | 230 Vues
Asset Classes and Financial Instruments. P.V. Viswanath For a First Course in INvestments. Learning Goals. What are the different asset classes? Why is it important to separate them by asset class ? What distinguishes the various asset classes?

E N D
Asset Classes and Financial Instruments P.V. Viswanath For a First Course in INvestments
Learning Goals • What are the different asset classes? • Why is it important to separate them by asset class? • What distinguishes the various asset classes? • Why are indices important and how are they constructed?
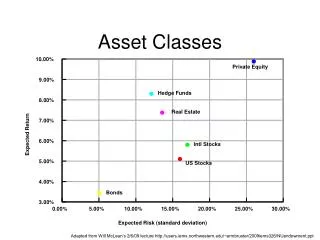
Asset Classes • Financial Assets can be categorized in different ways: • Criteria for categorization • Maturity • Liability/equity • Tax Status • Option characteristics • Q: Why is it important to separate them by asset class?
T-bill Quotations • T-bills represent promises of the government to the holder to pay a certain amount at a future date, usually within a year. • Investors buy the bills at a discount from the government from the stated maturity value. The return to the holder is the difference between the stated value received at maturity and the price paid in the beginning. • T-bills are usually quoted using the bank discount yield. • where FV is the face value of the bill, P is the price of the bill, and n is the number of days left to maturity on the bill. This is equal to the number of days left to maturity on the trade day less the one business day allowed for payment, following the skip-day settlement convention.
Dow Jones Index • The Dow, which represents 30 large "blue-chip" corporations, was originally computed as the simple average of the prices of the stocks in the index. • However, to ensure that the average did not change when there was a stock split, there were some adjustments to the weights, and hence to the divisor. • The percentage change in the Dow measures the return on a portfolio that holds one share in each stock. The amount of money invested in each stock is equal to the price of that stock.
Dow Jones Index • If Coca Cola splits as of the end of day 2, then we need to adjust the divisor (currently 2), so that the value of the index does not change. • This is necessary, if we presume that the stock split has not affected the "level" of the market. • Assuming that the split simply halved the price of Coca Cola’s stock, the new divisor, D, must satisfy the equation (32.25+132.375)/D = 98.4375; i.e. D = 1.67238. • Changes in the Dow Jones Index do not represent changes in the value of any portfolio.
S&P 500 Index • Represents a broad-based index of 500 stocks. • The Index is effectively the total market value of all the stocks in the index on each day. • Measures the return on a portfolio that invests an amount in each stock proportional to the market value of the outstanding shares.
Equally Weighted Indices • Measures the value of a portfolio that invests an equal amount in each stock at each point in time. • The percentage change in the index does not correspond to the return on any buy-and-hold portfolio. • For example, on day 1, to achieve the goal of investing an equal number of dollars in each stock, if we were to invest $50 in each stock, we would have to buy 50/63.75 = 0.7843 units of stock 1 and 50/135.25 = 0.3697 units of stock 2.
Equally Weighted Indices • From the first day to the second day, the return on Coca Cola would be (64.5/63.75) – 1 or 1.1765%; the return on Microsoft would be (132.375-125.25) – 1 or -2.126%. Hence the return on the portfolio would be a simple average of these two returns, or -0.475%. The value of the index, then, is 100(1-0.00475) or 99.525. This can also be computed by taking the number of shares in each stock and multiplying by the new share prices and adding.
Equally Weighted Indices • On day 2, the same number of shares in each stock would no longer be an equally-weighted portfolio, since the Microsoft shares would be worth 0.3697(132.375) or $48.94, while the Coca-Cola shares would be worth 0.7843(64.5) = $50.59. • Hence the next index value is computed by taking the simple average of the returns on the two stocks from day 2 to day 3 and grossing the index by that amount. For example, if Microsoft traded at 133 on day 3 and Coca-Cola at 65, their respective returns would be 0.47% (133/132.375) and 0.78% (65/64.5 - 1) • The simple average is 0.63%, and 99.526(1.0063) = 100.1491, which would be the next index value.