Download
1 / 35
350 likes | 362 Vues
HOW TO AVOID MISINTERPRETING MICROARRAY DATA Sungchul Ji, Ph.D. Department of Pharmacology and Toxicology Rutgers University Piscataway, N.J. 08855 sji@rci.rutgers.edu (DIMACS Workshop on Machine Learning Techniques in Bioinformatics,

E N D
HOW TO AVOID MISINTERPRETING MICROARRAY DATA Sungchul Ji, Ph.D. Department of Pharmacology and Toxicology Rutgers University Piscataway, N.J. 08855 sji@rci.rutgers.edu (DIMACS Workshop on Machine Learning Techniques in Bioinformatics, Center for Discrete Mathematics and Theoretical Computer Science, Rutgers University, Piscataway, July 11-12, 2006)
Measurement Interpretation Analysis DNA Microarray Technology The DNA Microarray Technology [1] inaugurated a new era in cell biology in the mid-1990’s. The integration of measurement, analysis and interpretation of genome-wide expression data is essential for the successful application of this revolutionary technology to cell biology. Of these three aspects of the new technology, interpretation has been least developed, as evidenced by misinterpretations (secondary to conflating transcription rates with transcript levels) of DNA microarray data found in numerous publications.
Output Input A theoretical model of the living cell is deemed essential in interpret DNA mciroarray data. The Bhopalator model of the cell proposed in 1985 may provide a useful starting point [2]. Because mRNA is broken down into nucleotides (step 2) as rapidly as it is synthesized (step 1), its concentration at any time is determined by both transcription (step 1) and degradation (step 2) rates. It has been the common practice in the field of microarray technology to assume that mRNA levels are determined mainly by transcription rate, but this assumption remains to be substantiated. On the contrary, simultaneous measurements of transcript levels (TL) and transcription rates (TR) from budding yeast subjected to glucose-galactose shift [3] indicate that TL is always controlled by the dual actions of transcription and transcript degradation, except occasionally by degradation alone [3a]. Another error commonly committed in the field is to conflate “gene expression” which is a rate process (i.e., concentration change per unit time) with “mRNA levels” which are just concentrations. 10 9 Gradients 5 6 4 Proteins Amino Acids 3 7 2 Ribo- nucleotides RNA 1 8 Genes Figure 1. The molecular model of the cell known as the Bhopalator [2].
How To Avoid Misinterpreting DNA Microarray Data: Do Not Say Gene Expression. Say mRNA Levels. • ‘Gene expression’ interpreted as transcription is not the same as mRNA levels: The former is a process and the latter a concentration. • Gene expression rate, dnS/dt, and mRNA levels, n, are mathematically related as follows: dn/dt = dnS/dt – βdnD/dt, where and β are constants, and dnD/dt is the rate of mRNA degradation. By a suitable integration, we obtain the following equation: Δn = dnS – βdnD, where is the integration over a given time period and dnS can be calculated as the AUC (Area Under the Curve) of the function, dnS/dt = f(t). • Mathematically speaking, Δn isa functional ofdnS/dt. That is, mRNA levels are functionals, not a function, of rates of gene expression.
The Six Modules of RNA Metabolism Observed in Budding Yeast Undergoing Glucose-Galactose Shift • The mechanisms of interactions between transcription and transcript degradation induced by the glucose-galactose shift in budding yeast have been studied based on the dual measurements of TL (transcript levels) and TR (transcription rates) by Perez-Ortin and his coworkers [3, 3a]. • Δni denotes the changes in the number of the ith mRNA molecule experienced by a cell during a given time period, and nS,i and nD,i indicate the numbers of the ith mRNA molecules per cell synthesized and degraded between two time points, respectively. The subscript i is omitted below for convenience. • There are six, and only six, modules of mRNA level control observed in yeast during glucose-galactose shift, labeled as A, B, C, D, E and F in the following table. Each module is characterized by a unique numerical value of the degradation-to-transcription ratio, nD/nS. This ratio was calculated from the equation relating the changes in transcript abundances (Δn) due to transcript synthesis (nS) and transcript degradation (nD) and the experimentally measured values of Δn and nS in [3, 3a]. Δn = nS – nD (1) • The above equation can be visualized as a 3-dimensional plane (hyperplane) as shown in the figure next to the table in the following slide.
The Cell-Brain-Computer Relation • Ontologically, cells gave rise to the human brain (step 1) which in turn gave rise to computers (step 2). • Epistemologically, the well-known properties of computers will facilitate our understanding of the functioning of the brain (step 3) and the cell (step 5). Knowing how our brain works can also help us understand how cell works (step 4), as exemplified by the recent proposal that cells use a language whose principles share commonalities with those of human language [4]. • As an example of the computer science helping biologists to understand the workings of the cell (step 5), one may cite the application of the SVM (support vector machine) approaches [5] to analyzing DNA mciroarray data.
The Cell as the Smallest DNA-Based Molecular Computer(S. Ji, BioSystems 52, 123-133, 1999) 2 1 Cells Brains Computers 4 3 DNA 5 Ontogeny = 1, 2 Epistemology = 3, 4, and 5
The Budding Yeast as the Hydrogen Atom of Cell Biology: The DNA microarray technique may play the role of the atomic spectroscopic technique in physisics which helped unravel the structure of the hydrogen atom [6].
The Cytoskeleton (Mouse Embryonic 3T3 cell)
The Complementary (+/-) Relations among the various DNA and RNA molecules involved in Microarray Experiments RP RT H (+) DNA ------ > (-) mRNA ------ > (+) DNA ------- > (-) DNA. | | DNA | Polymerase RP = RNA polymerase | or RT = Reverse transcriptase | Synthesizer H = Hybridizes to; no enzymes needed | \/ (-) DNA (Used to fabricate DNA microarrays)
There are two kinds of DNA microarrays – cDNA or EST microarray and the Gene Chips. One microarray can measure 104 mRNA levels simultaneously. mRNA levels in the cell are determined by mRNA synthesis (Vsyn) and mRNA hydrolysis or degradation (Vhyd), because the rate of change in mRNA levels (R) inside the cell is always: dR/dt = Vsyn - Vhyd (2) Only when certain kinetic conditions are met (discussed below) can mRNA levels measured with DNA microarrays can be interpreted as reflecting rates of gene expression [1, 3a]. Each square can recognize one kind of mRNA molecules. DNA Microarrays [1]
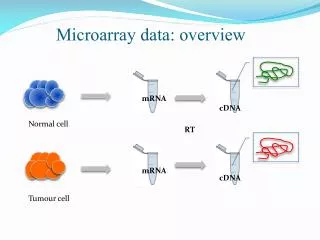
Isolate mRNA from broken cells. Synthesize fluorescently labeled cDNA from mRNA using reverse transcriptase and fluorescently labeled nucleotides. Prepare a microarray either with EST (Expressed Sequence Tag) or oligonucleotides (synthesized right on the microarray surface; see Affimetric,Inc.). Pour the fluorescently labeled cDNA preparations over the microarray surface to effect hybridization. Wash off excess debris. Measure fluorescently labeled cDNA hybridized to a microarray using a computer-assisted microscope. The final result is a table of numbers, each number registering the fluorescent intensity which is in turn proportional to the concentration of cDNA (and hence ultimately mRNA) located at row x and column y, row indicating the identity of genes, and y the conditions under which the mRNA levels are measured. How DNA Microarray Experiments are Done [1] 1 3 2 4 5 6 5
3 Transcription inside the cell Reverse transcription inside the test tube Hybridization on the microarray surface Probably millions of cDNA molecules are attached on each square on a DNA microarray. To the extent that mRNA is stable, the amount of mRNA formed during Step 1 can be estimated from the amount of cDNA bound to microarray surface in Step 3. But mRNA molecules inside the cell are unstable, because they are rapidly hydrolyzed into ribonucleotides by various ribonucleases. Therefore, it is impossible to estimate how many mRNA molecules are formed in Step 1 by measuring only how many molecules of cDNA are bound to microarray surface in Step 3 (more on this later). Covalent and Noncovalent Interactions in Microarray Experiments CTAATGT (Original DNA) 1 2 3
The changes in mRNA levels of human fibroblasts (cells of connective tissues that synthesize and secrete fibrillar procollagen, fibronectin, and collagenase) measured with DNA microarrays over a time period of 24 hours. Green represents a decrease in mRNA levels, black no change, and red an increase. Each kind of mRNA molecule is represented by a single row of colored boxes, and a measuring time point is represented by a single column. Notice that the mRNA molecules belonging to cluster A started to decrease around 8 hours after beginning experiment. The mRNA molecules belonging to cluster E began to increase at around 5 hours after the beginning of the experiment. The phrase “mRNA levels” in above statements is almost always replaced by “gene expression” (which phenomenon may be referred to as the “gene bias”), which is strictly speaking logically fallacious and can lead to false positive and false negative conclusions regarding the identities of the genes responsible for mRNA level changes. Cluster Analysis
The Duality of Transcription and Transcript Degradation. The Principle of Dual Control of mRNA Levels by Transcription and Transcript Degradation. The decreases in mRNA levels measured with DNA microarrays cannot be accounted for without invoking the mRNA degradation step. If there were no transcript degradation step, the mRNA levels inside the cell can only increase or remain constant, but never decrease.
Simultaneous Measurements of Genome-Wide Transcript Levels (TL) and Transcription Rates (TR) from the Yeast [3] (I) • Most DNA array measurements reported in the literature since the beginning of the DNA array era [1] have involved only mRNA levels, except Fan et al [7] and Garcia-Martinez et al [3], who measured both transcript levels (TL) and transcription rates (TR), the latter using nuclear run-on methods. • Because TL is determined by a dynamic balance between transcription and transcript degradation, TL is a function of both TR and transcript degradation rates, TD: TL = f(TR, TD) (3) Eq. (3) has three variables. Hence it cannot be solved without the input of the numerical values of any two of these three variables. • Most workers in the field in effect have been trying to solve Eq. (3) for TR by inputting just one of the two remaining numerical values, namely, TL, ignoring TD. This is mathematically impossible, and logically indefensible. Ignoring TD in an attempt to determine TR with TL measurements alone is tantamount to violating the Principle of Insufficient Reason, according to which if there is no sufficient reason for something's nonbeing, then it will exist. • The significance of the TL and TR data obtained by Fan et al [7] and Garcia-Martinez et al [3] is that their data allowed TD in Eq. (3) to be determined genome-wide for the first time.
Simultaneous Measurements of Genome-Wide Transcript Levels (TL) and Transcription Rates (TR) from the Yeast [3] (II) • Garcia-Martinez et al [3] measured TL and TR from budding yeast at six time points, 0, 5, 120, 360, 450 and 850 minutes after replacing glucose with galactose. • Typical plots of TR vs. TL revealed nonlinear trajectories as evident in the next slide. Each trajectory is divided into 5 directed segments (hence to be called TR-TL vectors). These vectors seem to assume all possible directions. • A total of 5,725 genes of budding yeast were analyzed and the directions (measured as shown in the next slide) of their component vectors (5 for each trajectory and 28,625 vectors in total) were calculated from their coordinates in the TR vs TL plane. The direction of these vectors were grouped into 9 categories based on their measured angles as follows: 1 = -3 to +3; 2 = 3 to 87; 3 = 87 to 93; 4 = 93 to 177; 5 = 177 to 183; 6 = 183 to 267; 7 = 267 to 273; 8 = 273 to 357; and 9 = 0 or undefineable. (I want to thank Dr. WonSsk Yoo for carrying out these calculations.) • The measured percentages of the vectors belonging to each category is as follows with the expected percentages given in parenthesis: 1 = 2.94% (1.67); 2 = 26.07% (23.33); 3 = 1.91% (1.67); 4 = 29.73% (23.33); 5 = 1.80% (1.67); 6 = 24.91% (23.33); 7 = 2.38% (1.67a); 8 = 10.26% (23.33); 9 = (not determined). These values are graphically represented as a histogram in the next slide. • Three conclusions can be drawn from these measurements: (i) The TL-TR vectors are distributed non-randomly over the 7 out of the 8 categories of directions. (ii) TL can increase even when TR decreases or undergo no change. (iii) TL can decrease even when TR increases. • Therefore, TL and TR can vary independently of each other. • Before these measurements were made, most workers assumed that TL and TR were related linearly.
TR 3 4 2 5 1 TL 9 6 8 7
Kinetic Equations Needed for Analyzing mRNA Metabolism • TL = Transcript Level, arbitrary unit • TR = Transcription Rate, arbitrary unit/min • n = mRNA molecules per cell = f(TL) = aTL + b (4) where a and b are constants determined empirically. • dnS/dt = rate of mRNA synthesis, molecules/cell/min = g(TR) = a’TR + b’ a’ and b’ are constants determined empirically. • dnD/dt = rate of mRNA degradation, molecules/cell/min • dn/dt = dnS/dt – βdnD/dt where and β are constants • Δn = dnS – β dnD(5) • Δn = nS – βnD + ε(6) where ε is a constant and nS and nD are the number of mRNA molecules synthesized and degraded, respectively, between two time points.If it is assumed that andβare unity andεis zero, the above equation reduces to: Δn = nS – nD + ε(7) which is visualized as the mRNA hyperpalne in the following slide. (I want to thank Drs. R. Miura, N. Fefferman & W. Chaovalitwongse for helpful suggestions in formulating these expressions)
The RNA Hyperplane: A Geometric Representation of the Six Modules of mRNA Metabolism Regulating mRNA Levels in Budding Yeast. The Symbols are defined in the table in a previous slide. Please note that Δn can be +, - or zero but nS and nD are always positive. (The delta sign in front of nS and nD seem unnecessary.)
Kinetics of Genome-Wide mRNA Level Changes Induced by Glucose-Galactose Shift in Budding Yeast • The genome-wide average TL values are plotted against time in Slide #25. • During the first 5 minutes after replacing glucose with galactose, the average TL value drops by about 30%, decreasing maximally by 60% during the next two hours. • The TL level begins to rise at about 360 minutes reaching a maximal value of 70% by 450 minutes. The level then decreases gain to 55% by 850 minutes. • The initial decline probably results from the decrease in ATP level in the cell due to inhibition of glycolysis, the main metabolic pathway to generate ATP in the presence of glucose (see Slide #28). • The abrupt rise in TL beginning at 360 minutes is most likely due to the induction of enzymes needed for metabolizing galactose, in part forming glucose (see the left-hand side of Slide #28). One evidence for this conjecture is the induction of the mRNA molecules (Gal 1, 2, 3, 7 & 10) coding for the proteins required for galactose metabolism beginning at 120 minutes (see Slide #27) and their suppression at around 360 minutes, probably due to the presence of glucose newly synthesized from galactose (see hi Glu in Slide #29).
Kinetics of the Glycolytic and Respiratory (or Oxidative Phosphorylation) mRNA Metabolism in Glucose-Derepressed Budding Yeast • Between 5 and 360 minutes after replacing glucose with galactose, the average mRNA levels of glycolytic and respiratory genes change in the opposite directions (see Slide #31a). • Strikingly, the average TR values for these two groups of genes change in a parallel manner as shown in Slide #31b. • Therefore, the opposite changes in the TL values of glycolytic and respiratory genes must be attributed to the opposite changes in the rates of their transcript degradation (TD). • The average degradation to transcription (D/T) ratios for glycolytic and respiratory genes at the 5 time points (corresponding to the mid-points of the 5 time segments, namely, 0-5, 5-120, 120-360, 360-450, & 450-850 minutes) were calculated using nD/nS = 1 – Δn/nS, derived from Equation (1) in Slide #5. These ratios are plotted in Slide #31c. • Based on the D/T ratios, we can assign the following sets of labels to the glycolytic and respiratory TL trajectories: Glycolysis = ECCAC Respiration = EAAAC
How to Interpret DNA Microarray Data (I) • What we measure with DNA microarrays are changes in florescence intensities. • The changes in fluorescence intensities can be divided into two categories – artifactual and non-artifactual. The present state of the development of the microarray technique is such that artifactual fluorescence intensity changes probably account for about 50%. This is why it is a common practice to use the notion of “fold changes” referring to fluorescence intensity changes that are greater than 100% (or one-fold change). • Only the non-artifactual fluorescence intensities can be related to mRNA levels. • mRNA levels measured with DNA microarrays can be divided into two categories – steady state and non-steady state. The difference between these two categories of mRNA levels can be represented mathematically as follows, where R is a mRNA level and t is time: Steady state : dR/dt = 0 . . . . . . . . . . . . . . . . . . . . . . . . . . . . . . . . . . . . (8) Non-steady state: dR/dt 0 • The steady-state mRNA levels divide into two categories – dynamic and equilibrium. The intracellular levels of mRNA molecules are always determined by two terms – the source term (i.e., the rate of mRNA synthesis, denoted by dRS/dt) and the sink term (i.e., the rate of mRNA hydrolysis into smaller fragments, denoted as dRD/dt ): dR/dt = dRS/dt - dRD/dt . . . . . . . . . . . . . . . . . . . . . . . . . . . . (9) There are two ways of making Eq. (9) = 0; when dRS/dt and dRD/dt are equal and non-zero, and when dRS/dt and dRD/dt are both equalt to zero: Dynamic steady state: dRS/dt = dRD/dt . . . . . . . . . . . . . . . . . . . . . . . . . . . . (10) Equilibrium steady state: dRS/dt = dRD/dt = 0 . . . . . . . . . . . . . . . . . . . . . . . . . (11)
How to Interpret DNA Microarray Data (II) • The non-steady state mRNA levels divide into two categories: On-the-way-up, or Ascending: dR/dt > 0 . . . . . . . . . . . . . . . . . . . . . . . . . . . . (12) On-the-way-down or Descending: dR/dt < 0 . . .. . . . . . . . . . . . . . . . . . . . . . . . . (13) • It is probably safe to assume that dRS/dt always independent of R (i.e., gene expression is turned on or off by factors other than intracellular levels of corresponding mRNA levels). But dRD/dt may often (if not always) depend on R, leading to the conclusion that there are at least two categories of dynamic steady states: Zero-order dynamic steady state: dRD/dt = k (R)0 = k . . . . . . . . . . . . . . . . . . (14) First-order dynamic steady state: dRD/dt = kR . . . . . . . . . . . . . . . . . (15) • These results can be summarized as follows: • Combining Equations (10) and (15) leads to the following useful relation: dRS/dt = dRD/dt = kR . . . . . . . . . . . . . . . . . . . . . . . . . . . . . . . . . . . . . (16) Equation (16) states that, under the conditions of a dynamic steady state, the mRNA levels, R, measured with DNA microarrays are directly proportional to the rates of expression of their corresponding genes, dRS/dt, since it is equal to dRD/dt, the rate of transcript degradation, under a dynamic steady state. • An important corollary of Equation (16) is that, under all other conditions, there is no direct proportionality relation between mRNA levels and the rates of expression of their corresponding genes.
Dissipative and Equilibrium Networks in the Living Cell:I. Prigogine (1917-2003) distinguished between two fundamental classes of structures in nature – equilibirum and dissipative structures. The former can exist without any input of free energy whereas the latter exist if and only if a continuous dissipation of free energy supports them. Similarly, it is proposed here that ‘dissipative networks’ in cells (e.g., some protein-protein interaction networks) disappear upon cessation of free energy input, while ‘equilibrium networks’ (e.g., Krebs cycle, glycolytic pathway, etc.) can persist without any dissipation of free energy. The protein network is unique in that it is the only network that can tap free energy from chemical reactions. Dissipativenetworks may also be referred to as the “Self-Organizing-Whenever-and-Wherever-Needed (SOWAWN) Machine”.
References: [1] Watson, S. J., and Akil, U. (1999). Gene Chips and Arrays Revealed: A Primer on Their Power and Their Uses. Biol. Psychiatry45:533-543. [2] Ji, S. (1985). The Bhopalator – A Molecular Model of the Living Cell Based on the Concepts of Conformons and dissipative Structures. J. theoret. Biol. 116:399-426. [3] Garcia-Martinez, J., Aranda, A., and Perez-Ortin, J. E. (2004). Genomic Run-On Evaluates Transcription Rates for all Yeast Genes and Identifies Gene Regulatory Mechanisms. Mol. Cell15:303-313. [3a] Ji, S., Chaovalitwongse, W., Fefferman, N., and Perez-Ortin, J. E. (2006). The Six Modules of Transcript Control Revealed by Genome-Wide Expression Data from Glucose-Derepressed Saccharomyces cerevisiae. (in preparation). [4] Ji, S. (2004). Molecular Information Theory: Solving the Mysteries of DNA. In: Modeling in Molecular Biology (Ciobanu, G., and Rozenberg, G., eds.), Springer, Berlin. Pp. 141-150. [5] Cristianini, N., Shawe-Taylor, J. (2000). An Introduction to support Vector Machines and other kernel-based learning methods. Cambridge University Press, Cambridge. [6] Ji, S. (2005). Semiotics of Life: A Unified Theory of Molecular Machines, Cells, the Mind, Peircean Signs and the Universe Based on the Principle of Information and Energy Complementarity. Reports, Research Group on Mathematical Linguistics, Rovira i Virgili University, Tarragona, Spain. See the section entitled An Analogy between Atomic Physics and Cell Biology on pp. 58-61, available at http://www.grlmc.com, under Publications. [7] Fan, J., Yang, X., Wang, W., Wood, W. H., Becjer, K. G., and Gorospec, M. (2002). Global analysis of stress-regulated mRNA turnover by using cDNA arrays. Proc. Nat. Acad. Sci. US99(16):10611-10616.