Download
1 / 22
220 likes | 382 Vues
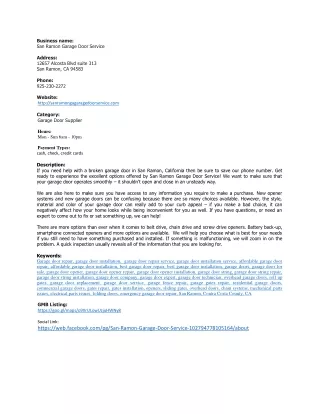
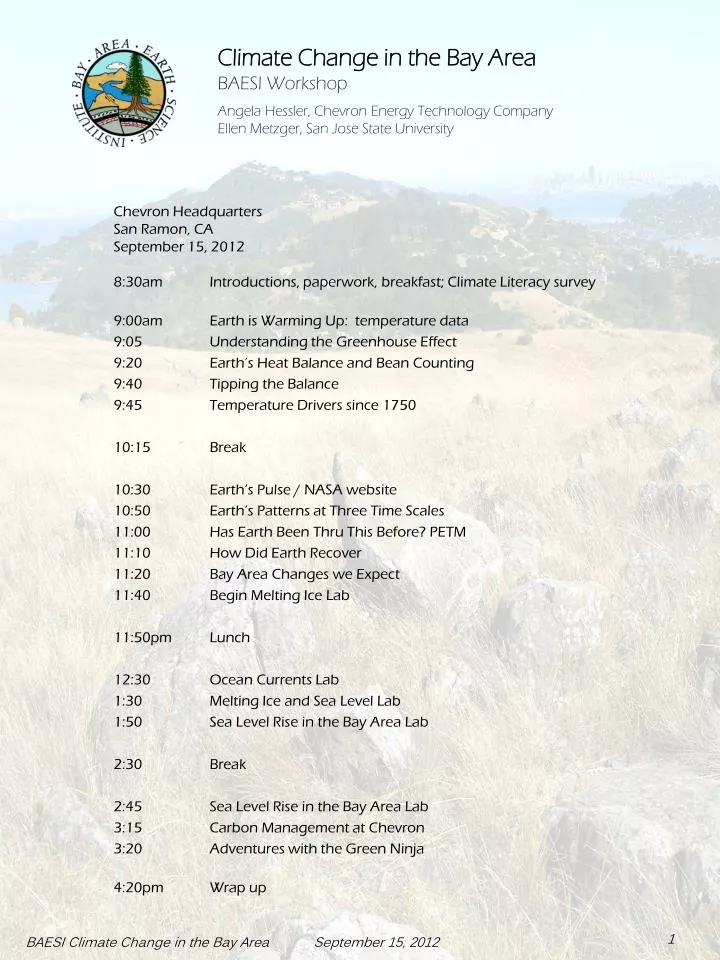
Climate Change in the Bay Area BAESI Workshop Angela Hessler, Chevron Energy Technology Company Ellen Metzger, San Jose State University. Chevron Headquarters San Ramon, CA September 15, 2012 8:30am Introductions, paperwork, breakfast; Climate Literacy survey

E N D
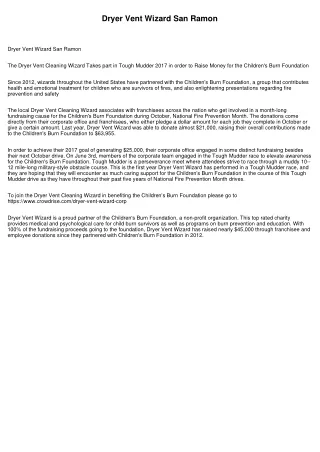
Climate Change in the Bay AreaBAESI Workshop Angela Hessler, Chevron Energy Technology CompanyEllen Metzger, San Jose State University Chevron Headquarters San Ramon, CA September 15, 2012 8:30am Introductions, paperwork, breakfast; Climate Literacy survey 9:00am Earth is Warming Up: temperature data 9:05 Understanding the Greenhouse Effect 9:20 Earth’s Heat Balance and Bean Counting 9:40 Tipping the Balance 9:45 Temperature Drivers since 1750 10:15 Break 10:30 Earth’s Pulse / NASA website 10:50 Earth’s Patterns at Three Time Scales 11:00 Has Earth Been Thru This Before? PETM 11:10 How Did Earth Recover 11:20 Bay Area Changes we Expect 11:40 Begin Melting Ice Lab 11:50pm Lunch 12:30 Ocean Currents Lab 1:30 Melting Ice and Sea Level Lab 1:50 Sea Level Rise in the Bay Area Lab 2:30 Break 2:45 Sea Level Rise in the Bay Area Lab 3:15 Carbon Management at Chevron 3:20 Adventures with the Green Ninja 4:20pm Wrap up BAESI Climate Change in the Bay Area
What do we know: Earth is Warming Up • Adequate spatial coverage (measurement stations) since 1880 • Today use 6300+ stations • Data from NASA’s Goddard Institute for Space Studies (GISS) • Agrees with trends from other global temperature analyses • Anomaly = how much does annual mean differ from a baseline value • Here the average temperature between 1951 – 1980 (14°C) • Warming seen at all latitudes • Greatest change at northern latitudes and over land AGT rise = 1.5°F since 1880 BAESI Climate Change in the Bay Area
What concepts do we need to understand: The Greenhouse http://chuma.cas.usf.edu/~juster/S7/atmosphere.htm Solar Radiation: “Sunlight” is the full frequency spectrum of electromagnetic energy emitted from the Sun; mostly infrared (long - thermal), visible (medium), and ultraviolet (short) waves Surface Radiation: Long-wave (infrared - thermal) energy emitted by Earth Natural frequency (NF): Rate at which materials (i.e. their electrons) vibrate upon being set in motion; long wavelength equals low frequency Light Transmission: Waves pass through a material as light energy (light NF ≠ material NF) Light Reflection: Waves re-emitted from a material as light energy (light NF ≠ material NF) Light Absorption: : Waves are converted within a material to other energy form (i.e. thermal) (light NF = material NF) Example: CO2 absorbs light at frequencies of 4300 nanometers (4.3 x 10⁻⁶ meters) and 15,300 nanometers (1.53 x 10⁻⁵ meters); greenhouse gases are ones that absorb and emit infrared light BAESI Climate Change in the Bay Area
Why does Earth have a ‘temperature’: Earth’s Heat Balance Evapo-transpiration and convection 100 W m-2 Based on observations March 2000 to May 2004 (NASA/Sally Bensusen redrawn from Kiehl and Trenberth 1997); • BEAN COUNTING ACTIVITYONE BEAN = 10 Wm-2 • Find “Incoming Solar Radiation” on the diagram. From your bag of beans, count out the correct number of beans (rounded to the nearest “10”) and place on “Incoming Solar Radiation.” • Move these beans down to where there are two forks in the path. • Absorb (move) the correct number of beans into the atmosphere (right fork). • Reflect (move) the correct number of beans to the “Reflected Solar Radiation” position (left fork). • Move the remaining beans downward to be “Absorbed by Land and Water” at Earth’s surface. • Move the correct number of “Absorbed by Land and Water” beans back to the atmosphere via “Evapo-transpiration and Convection”. • Find “Surface Radiation” on the diagram. From your bag of beans, count out the correct number of beans and place on “Surface Radiation.” • Move the correct number of “Surface Radiation” beans all the way through the “Atmosphere Window” and place on the “Outgoing Longwave Radiation” position. • Move the remaining “Surface Radiation” beans as longwave (infrared) radiation into the atmosphere. • Emit the correct number of beans from the atmosphere and place on the “Outgoing Longwave Radiation” position. Don’t forget the beans you already placed in the atmosphere in Steps 3 and 6! • Back-radiate the correct number of beans as longwave (infrared) radiation from the atmosphere and place on the “Absorbed by Land and Water” position. • Combine the beans now at the Surface. Count them. _____ How many Wm-2 is this? _____ • Is the absorbed radiation in balance with the value for “Surface Radiation”? _______ • Count the beans at both the “Reflected Solar Radiation” and “Outgoing Longwave Radiation” positions. _____ Add the two numbers together. ______ How many Wm-2 is this? ________ • Is the total outgoing radiation in balance with the Incoming Solar Radiation? ______ BAESI Climate Change in the Bay Area
Why does Earth warm up: Tipping the Balance WHAAAA…….!! BUT FUNDAMENTALLY: Increase the amount of sunlight coming in. Decrease the amount of sunlight reflecting back out. Increase the amount of surface radiation. Increase the amount of radiation absorbed by the atmosphere. POSITIVE FEEDBACK LOOPS CAN AMPLIFY INITIAL WARMING BAESI Climate Change in the Bay Area
Why Does This Happen: Temperature Drivers since 1750 • RADIATIVE FORCING (RF) ACTIVITY • 1. Select a “RF” card from your table. • 2. Look around the classroom for the sign that matches the title of your card. Stand by the sign and wait for the rest of your “RF Group” to join you. • 4. As a group, prepare to briefly explain your specific RF component to the class. • 5. In five minutes, we will come together to: • Learn about each RF component • Determine which RFs cool and which RFs warm • Compare group size (how powerful is your RF component?) • Calculate the NET ANTHROPOGENIC EFFECT BAESI Climate Change in the Bay Area
How Do We Know: Earth’s Pulse http://climate.nasa.gov/ Global Surface Temperature Carbon Dioxide Concentration Arctic Sea Ice Land Ice Sea Level BAESI Climate Change in the Bay Area
Where does this fit in the Big Picture:Earth’s Patterns at Three Time Scales Hessler 2012 Nature Education Veizer et al 1999 Brooks, 2008 Nature BAESI Climate Change in the Bay Area
What can we learn from the past:Has Earth Been Through This Before? BAESI Climate Change in the Bay Area
How did Earth recover:Negative Feedback Loop BAESI Climate Change in the Bay Area
What can we expect:Bay Area Changes BAESI Climate Change in the Bay Area
Lab #1 exercise:Ocean Currents • DEMO: GETTING STARTED • STATION 1: SALINITY • STATION 2: TEMPERATURE • STATION 3: POLAR VERSUS TROPICAL WATER • STATION 4: DESIGN YOUR OWN OCEAN • DEMO: PUTTING IT TOGETHER BAESI Climate Change in the Bay Area
Lab #1 discussion:Ocean Currents: Wind &Thermohaline Density BAESI Climate Change in the Bay Area
Lab #1 discussion:Ocean Currents: Measuring Salinity Ocean salinity is measured in parts per thousand (‰, “per mil”) or g/L. http://aquarius.nasa.gov/gallery-science.html UCSC: Deep-diving Sea Lions! Black contours = modern T Color contours = Pliocene T BAESI Climate Change in the Bay Area
Lab #1 discussion:Ocean Currents: How Much is Needed Ocean salinity is measured in parts per thousand (‰, “per mil”) or g/L. http://aquarius.nasa.gov/gallery-science.html Black contours = modern T Color contours = Pliocene T Levitus S. (1998). NODC World Ocean Atlas 1998 data, report, 1998 :NOAA-CIRES Clim. Diag. Cent. Boulder, Colorado BAESI Climate Change in the Bay Area
Lab #1 discussion:Ocean Currents – Bay Area BAESI Climate Change in the Bay Area
Lab #2 exercise: Melting Ice and Sea Level • ACTIVITY: LAND ICE and SEA ICE BAESI Climate Change in the Bay Area
Lab #3 exercise: Sea Level Rise in the Bay Area • TOPO MAP INTRO • MOUNTAIN VIEW QUAD 1. Highlight the 5’ contour. (The 2010 US NRC predicts a 6.6’ rise by 2100) 2. Which of the following features will be inundated by a 5’ sea level rise? Ohlone School (South of Oregon and Hwy 101) Palo Alto County Airport Sewage Disposal near Charleston Slough 3. Highlight the 20’ contour. (The 2007 IPCC predicts a 20+’ rise over next centuries) 4. Which of the following features will be inundated by a 20’ sea level rise: Runways at Moffett Field Shoreline Ampitheater Sunnyvale Municipal Golf Intersection of Maude Ave and Matilda Ave Sunnyvale Baylands Park Aqueduct at east edge of map near Lakehaven Dr. 5. Highlight the 40’ contour. Which increment of sea level rise affects a larger area, the first (from 0’to 20’) or the second (from 20’ to 40’)? • YOUR ADDITIONAL MAP 1. Turn over your map. What is the name of your map? 2. What is its contour interval? 3. Choose a sea level rise increment (i.e. 5’, 10’, 20’…) and highlight its contour line. 4. List a few interesting features that would be inundated by that increment of rise. • YOUR NEIGHBOR’S MAP(S) 1. List the name(s) of your neighbor’s map(s). 2. List a couple of interesting observations they made about sea level rise on their map(s). BAESI Climate Change in the Bay Area
Lab #3 discussion: Sea Level Rise in the Bay Area • DISCUSSION • KQED Quest video (13 minutes): “GOING UP: Sea Level Rise in San Francisco Bay” • Interactive Maps: Impacts of Sea Level Rise on the CA Coast (Pacific Institute) BAESI Climate Change in the Bay Area
Energy Company Perspective: “Carbon Management” at Chevron Position Statement:“At Chevron, we recognize and share the concerns of governments and the public about climate change. The use of fossil fuels to meet the world’s energy needs is a contributor to an increase in greenhouse gases (GHGs) — mainly carbon dioxide (CO2) and methane — in the earth’s atmosphere. There is a widespread view that this increase is leading to climate change, with adverse effects on the environment.” Seven principles for addressing climate change • Global Engagement • Energy Security • Maximize Conservation • Measured and Flexible Approach • Broad, Equitable Treatment • Enable Technology • Transparency Four-fold action plan • Reducing emissions of GHGs and increasing energy efficiency • Investing in research, development and improved technology • Pursuing business opportunities in promising, innovative energy technologies • Supporting flexible and economically sound policies, and mechanisms that protect the environment BAESI Climate Change in the Bay Area
Adventures with theGreen Ninja BAESI Climate Change in the Bay Area
Climate Change in the Bay AreaBAESI Workshop Angela Hessler, Chevron Energy Technology CompanyEllen Metzger, San Jose State University Thank you! BAESI Climate Change in the Bay Area