Download
1 / 4
40 likes | 119 Vues
14. 12. -. -. 10. -. +. 24h. 96h. 8. Dry weight (g/l). +. 48h. 72h. 6. 4. 2. 0. 0. 24. 48. 72. 96. GG20. GG50. Time (h). NG20. NG50. A). B).

E N D
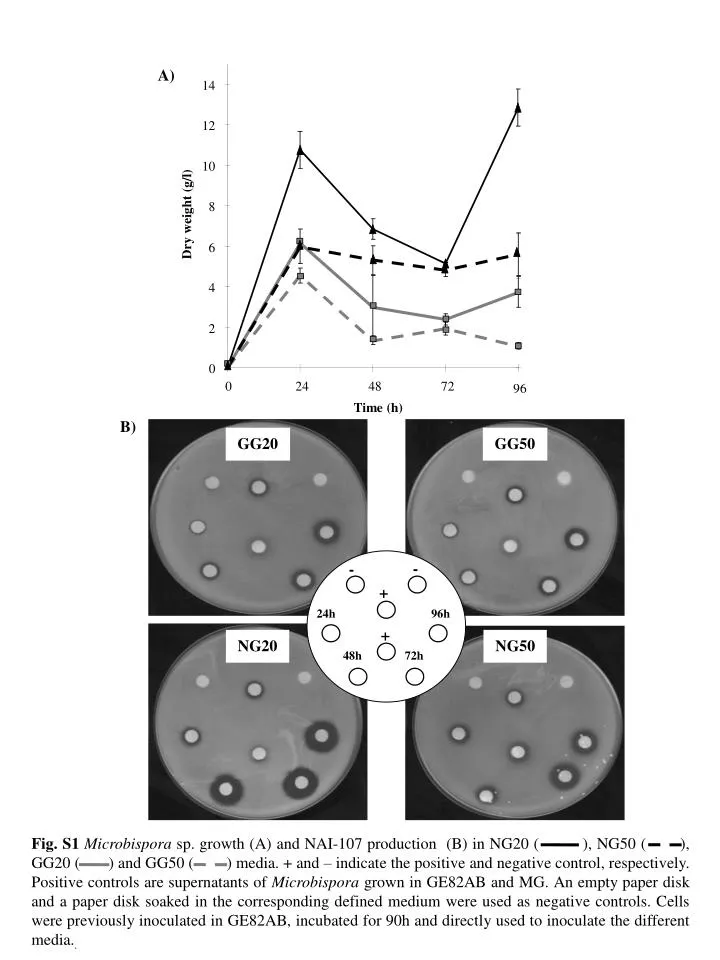
14 12 - - 10 - + 24h 96h 8 Dry weight (g/l) + 48h 72h 6 4 2 0 0 24 48 72 96 GG20 GG50 Time (h) NG20 NG50 A) B) Fig. S1Microbispora sp. growth (A) and NAI-107 production (B) in NG20 ( ), NG50 ( ), GG20 ( ) and GG50 ( ) media. + and – indicate the positive and negative control, respectively. Positive controls are supernatants of Microbispora grown in GE82AB and MG. An empty paper disk and a paper disk soaked in the corresponding defined medium were used as negative controls. Cells were previously inoculated in GE82AB, incubated for 90h and directly used to inoculate the different media..
A) B) Fig. S2 Putative PHO box sequences found in upstream regions of Microbispora pho regulon genes(A).Translational start codons andtranscription direction are indicated with bold letters and arrows, respectively. PHO boxes direct repeats (DRs) are underlined. B) Consensus of the direct repeats of 11 nt that forms the Microbispora PHO box, obtained using free-on line available WebLogo software http://weblogo. berkeley.edu/logo.cgi. The height of each letter is proportional to the frequency of the base. Error bars are shown at the top of the stacks.
Fig. S3 Calibration curve constructed using known concentrations of NAI-107.
A) Qty/ng*105 B) Fig. S4 Absolute Quantitative RT-PCR of hrdB using RNA extracted after 24 and 72h of Microbispora sp. growth in P0.1 (light grey), P0.5 (dark grey) and P5 (black) media. Error bars were calculated from three independent experiments (A). The values were calculated using a standard curve obtained measuring fluorescence of known amounts (10, 100, 1000, 10000 µg) of c-DNA (B).