Download
1 / 66
660 likes | 791 Vues
Atmospheres & Global Warming Earth and the Other Terrestrial Worlds. Weather and Climate. Weather – short-term changes in wind, clouds, temperature, and pressure in an atmosphere at a given location. These are Earth’s global wind patterns or circulation

E N D
Atmospheres &Global WarmingEarth and the Other Terrestrial Worlds
Weather and Climate Weather – short-term changes in wind, clouds, temperature, and pressure in an atmosphere at a given location • These are Earth’s global wind patterns or circulation • local weather systems move along with them • weather moves from W to E at mid-latitudes in N hemisphere • Two factors cause these patterns • atmospheric heating • planetary rotation Climate– long-term average of the weather at a given location
Air heated more at equator Warm air rises at equator; Pressure pushes to poles Cold air moves from poles to equator along the surface Two circulation cells are created in each hemisphere Cells of air do not go directly from pole to equator; air circulation is diverted by… Coriolis effect moving objects veer right on a surface rotating counterclockwise moving objects veer left on a surface rotating clockwise Global Wind Patterns
Global Wind Patterns • On Earth, the Coriolis effect breaks each circulation cell into three separate cells • winds move either W to E or E to W • Coriolis effect not strong on Mars & Venus • Mars is too small • Venus rotates too slowly • In thick Venusian atmosphere, the pole-to-equator circulation cells distribute heat efficiently • surface temperature is uniform all over the planet
Pressure & density of decrease with altitude Temperature both increases and decreases with altitude Temperature domains define the major atmospheric layers exosphere low density; fades into space thermosphere temp begins to rise at the top stratosphere UV light heats air (ozone absorbs it.) troposphere layer closest to surface Convection heats air (rising hot air) temp drops with altitude Structure of Earth’s Atmosphere (mesosphere) Stratosphere Ozone Layer (absorbs UV) Troposphere
Structure of Terrestrial Planet Atmospheres • Mars, Venus, Earth all • have warm tropospheres (and greenhouse gases) • have warm thermospheres which absorb Solar X rays • Only Earth has • a warm stratosphere • an UV-absorbing gas (O3) • All three planets have warmer surface temps due to greenhouse effect
CFCs Attack Ozone (O3) The stratospheric ozone is an environmental success story. Scientists detected the declining ozone in the atmosphere, collecting the evidence that convinced governments around the world to take regulatory action.
Climate History of Venus • Venus should have outgassed as much H2O as Earth. • Early on, when the Sun was dimmer, Venus may have had oceans of water • Venus’ proximity to the Sun caused all H2O to evaporate. • H2O caused runaway greenhouse effect • surface heated to extreme temperature • CO2 released from rocks: Adds to greenhouse effect • UV photons from Sun dissociate H2O; H2 escapes, O is stripped If Earth moved to Venus’ Orbit
Venusian Weather Today • Venus has no seasons to speak of. • rotation axis is nearly 90º to the ecliptic plane • Venus has little wind at its surface • rotates very slowly, so there is no Coriolis effect • The surface temperature stays constant all over Venus. • thick atmosphere distributes heat via two large circulation cells • There is no rain on the surface. • it is too hot and Venus has almost no H2O • Venusian clouds contain sulfuric acid! • implies recent volcanic outgassing?
Mars’ Thin Atmosphere • Martian sunset illustrates just how thin the Martian atmosphere is.
Martian Weather Today • Seasons on Mars are more extreme than on Earth • Mars’ orbit is more elliptical • CO2 condenses & vaporizes at opposite poles • changes in atmospheric pressure drive pole-to-pole winds • sometimes cause huge dust storms
The last decade of the 20th Century was the warmest in the entire global instrumental temperature record, starting in the mid-1800’s. • All 10 years rank among the 15 warmest, and include the 6 warmest years on record. • Through the reconstruction of past climate we can evaluate the rarity and magnitude of this warming.
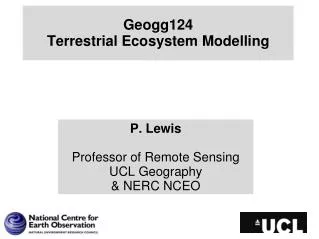
Venus Earth Mars 0.7 AU 1 AU 1.5 AU 4.6 Billion Years Ago ... SUN (150 million km from Sun)
500 300 Temperature (Celsius) 100 0 -100 Temperature: Top of Atmosphere decreases with distance from Sun Earth -18oC (0oF) Venus Mars 0 0 AU 1 AU Distance From Sun -100 5500 oC
EARTH: Surface 15oC (60oF) Top of Atm: -18oC (0oF) 500 300 All three phases of water 100 Temperature (Celsius) 0 -100 Surface No Greenhouse Surface warmer than top of atm Greenhouse Effect Clue: atm composition
n1symmetric O O C C n2 bending 15 mm O O n2asymmetric 4.3 mm O C O Vibrational Modes for CO2 Greenhouse effect:Radiation at specific wavelengths excite CO2 into higher energy states. Light energy is absorbed by the CO2 molecules
O O O H O H H H C H N O N H nitrous oxide methane Other Greenhouse Gases ozone water
Absorption Transmission Peak terrestrial emission at ~300K Absorption by different molecules l = 0-15 µm CO2 Bending Mode
Carbon Dioxide:in our atmosphere isIncreasing rapidly Burning coal Worldwide CO2 Emission By fuel type: 1970 - 2020 gasoline CO2 Causes Global Warming: Stay tuned . . . Natural gas
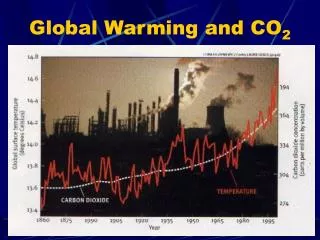
Increase in Temperature tracks Increase in Greenhouse Gases Since 1850: Atmospheric CO2 has increased by 30% Temperature vs Time Year 1850 2000
CO2 Since the Year 1000 AD CO2 in atmosphere, measured in thick arctic ice.
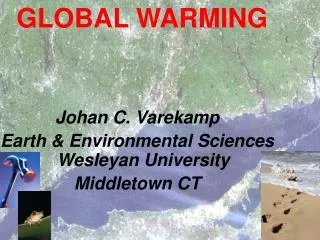
CO2 Deuterium (hydrogen with a neutron) Time (thousands of years before present) Variations of deuterium (δD) in antarctic ice, which is a proxy for local temperature, and the atmospheric concentrations of the greenhouse gases carbon dioxide (CO2), methane (CH4), and nitrous oxide (N2O) in air trapped within the ice cores and from recent atmospheric measurements. Data cover 650,000 years and the shaded bands indicate current and previous interglacial warm periods.
Figure TS.6 Patterns of linear global temperature trends over the period 1979 to 2005 estimated at the surface (left), and for the troposphere from satellite records (right). Grey indicates areas with incomplete data. (Bottom) Annual global mean temperatures (black dots) with linear fits to the data. The left hand axis shows temperature anomalies relative to the 1961 to 1990 average and the right hand axis shows estimated actual temperatures, both in °C. Linear trends are shown for the last 25 (yellow), 50 (orange), 100 (magenta) and 150 years (red). The smooth blue curve shows decadal variations (see Appendix 3.A), with the decadal 90% error range shown as a pale blue band about that line. The total temperature increase from the period 1850 to 1899 to the period 2001 to 2005 is 0.76°C ± 0.19°C.
Retreat of Glaciers 2006 1948 2002 Trift Glacier, Gadmental, Berner, Oberland Switzerland
Easton Glacier A 2003 photograph of the ~2.9 square kilometer Easton Glacier on Mount Baker in Washington State. Between ~1890 and 1950, this glacier retreated ~2400 meters. It subsequently expanded 600 meters during a locally cold period between 1950 and 1979. Since then, it has again retreated 315 meters (as of 2002) with 150 meters lost solely between 1997 and 2002.[1]. The extent of the glacier in 1985 is indicated in the figure.
1939 1951 • Franz Josef Glacier In Retreat 1964 1960
All survey regions except Scandinavia show a net thinning. This widespread glacier retreat is generally regarded as a sign of global warming. During this period, 83% of surveyed glaciers showed thinning with an average loss across all glaciers of 0.31 m/yr.
Receding Glaciers Glacier Length (km) South Cascade Glacier in Washington. The yellow line indicates the location of the terminus in 1958. The red line shows the position of the terminus in 1998. 1500 2000
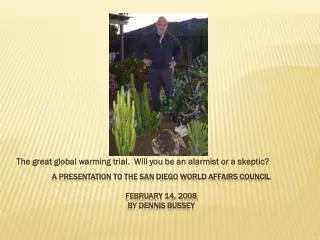
Is the Sun to Blame ? No. Luminosity has been constant. (Solar max) Percentage change in monthly values of the total solar irradiance composites of Willson and Mordvinov (2003; WM2003, violet symbols and line) and Fröhlich and Lean (2004; FL2004, green solid line). • Sunlight hitting Earth: • 11 year Sunspot cycle • Offsets among instruments • No trend
Global Warming • Made a political issue by certain people. Three Facts are Absolute: • Earth has warmed by 0.5 C in past 50 years. Temperature rise greatest in past 10 years. • Humans are increasing by 30-50% the CO2 in the atmosphere. • Rising CO2 will cause rising temperatures Only Question: Not Whether, but by how much are humans contributing to Global Warming ?
Feedback Proceses:Positive and Negative Suppose Temp rises ==> Evaporation of ocean water. Feedback: • H2O is a greenhouse gas ==> Earth gets even Warmer ! • But clouds may form, increasing albedo. ==> Earth cools.
The Arctic:Positive Feedback Process • Temp rise causes polar cap ice to melt. • Artic ground exposed: dirt absorbs more sunlight (lower albedo). • Ground warms up more: Earth gets hotter. • More polar cap ice melts. Earth gets even hotter.
Consequences ofGlobal Warming • More evaporation of oceans: More storms, and more severe storms. • Water in oceans expand with rising Temp. Sea level has already risen 20 cm in past 100 years. Coastal regions and islands flood. • Polar caps and Glaciers melt: Causes rising ocean levels. • Change in ocean current patterns. Desserts may get rain; Farmland may get none.
Consequences ofGlobal Warming Consequences of Global Warming According to UN report: the world will be a much hotter place by 2100. +2.4。: Coral reefs almost extinct In North America, a new dust-bowl brings deserts to life in the high plains states, centeredd on Nebraska, but also wipes out agriculture andcattle ranching as sand dunes appear across five US states, from Texas in the south to Montana in the north.Rising sea levels accelerate as the Greenland ice sheet tips into irreversible melt, submerging atoll nations and low-lying deltas. In Peru, disappearing Andean glaciers mean 10 million people face water shortages. Warming seas wipe out the Great Barrier Reef and make coral reefs virtually extinct throughout the tropics. Worldwide, a third of all species on the planet face extinction+3.4。: Rainforest turns to desertThe Amazonian rainforest burns in a firestorm of catastrophic ferocity, covering South America with ash and smoke. Once the smoke clears, the interior of Brazil has become desert, and huge amounts of extra carbon have entered the atmosphere, further boosting global warming. The entire Arctic ice-cap disappears in the summer months, leaving the North Pole ice-free for the first time in 3 million years. Polar bears, walruses and ringed seals all go extinct. Water supplies run short in California as the Sierra Nevada snowpack melts away. Tens of millions are displaced as the Kalahari desert expands across southern Africa+4.4。: Melting ice caps displace millionsRapidly-rising temperatures in the Arctic put Siberian permafrost in the melt zone, releasing vast quantities of methane and CO2. Global temperatures keep on rising rapidly in consequence. Melting ice-caps and sea level rises displace more than 100 million people, particularly in Bangladesh, the Nile Delta and Shanghai. Heatwaves and drought make much of the sub-tropics uninhabitable: large-scale migration even takes place within Europe, where deserts are growing in southern Spain, Italy and Greece. More than half of wild species are wiped out, in the worst mass extinction since the end of the dinosaurs. Agriculture collapses in Australia+5.4。: Sea levels rise by five metresThe West Antarctic ice sheet breaks up, eventually adding another five metres to global sea levels. If these temperatures are sustained, the entire planet will become ice-free, and sea
Predictions of temperatures next 100 years DEPENDS ON MAGNITUDE OF FEEDBACK AND RATE OF INCREASE OF GHG. IN 100 YEARS, FORCED CLIMATE CHANGE WILL MOST LIKELY EXCEED NATURAL VARIABILITY
The Kyoto Agreement The Kyoto Protocol, negotiated by more than 160 nations in 1997, will reduce emissions of certain greenhouse gases (primarily CO2). Each of the participating developed countries must decide how to meet its respective reduction goal. Signed by every country in the European Union, by Japan, and by Russia.
Kyoto Agreement:The United States Won’t Sign • In March 2001, President Bush announced that the United States would not sign the Kyoto Protocol on Global Climate Change. • The Protocol requires signatories to cut carbon dioxide emissions an average of 5 percent below 1990 levels between 2008 and 2012. Developing nations are exempt from emission reductions. • “President Bush strongly opposes any treaty or policy that would cause the loss of a single American job, let alone the nearly 5 million jobs Kyoto would have cost.” - James Connaughton, chairman of the White House council on Environmental Quality.
Stop Here.Show: An Inconvenient Truth • Get DVD somewhere. • Interesting Chapters: • 5-9, 11, 16-17, 20, • 21-28, 30-32 (or 5-9, 16-28) Takes 30 min.
Three Perspectives onGlobal Warming • Kyoto Protocol: unfccc.int/resource/convkp.html • White House Council on Environmental Quality: www.whitehouse.gov/ceq • Pew Center on Global Climate Change: www.pewclimate.org
Clouds, Rain and Snow • Clouds strongly affect the surface conditions of a planet • they increase its albedo, thus reflecting away more sunlight • they provide rain and snow, which causes erosion • Formation of rain and snow: