1 / 28
280 likes | 287 Vues
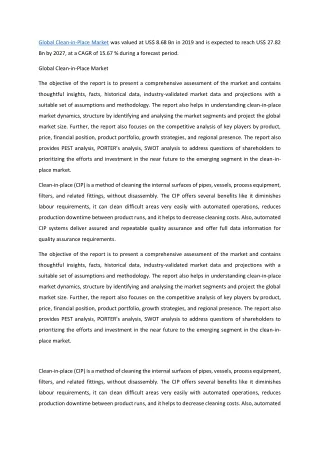
Clean label ingredients market is expected to grow with a CAGR of 8.65% and reach $32.08 billion by 2026. Clean label ingredients Industry in the application segment is expected to be dominated by the food sector.<br>visit: https://bisresearch.com/industry-report/clean-label-ingredients-market.html

E N D
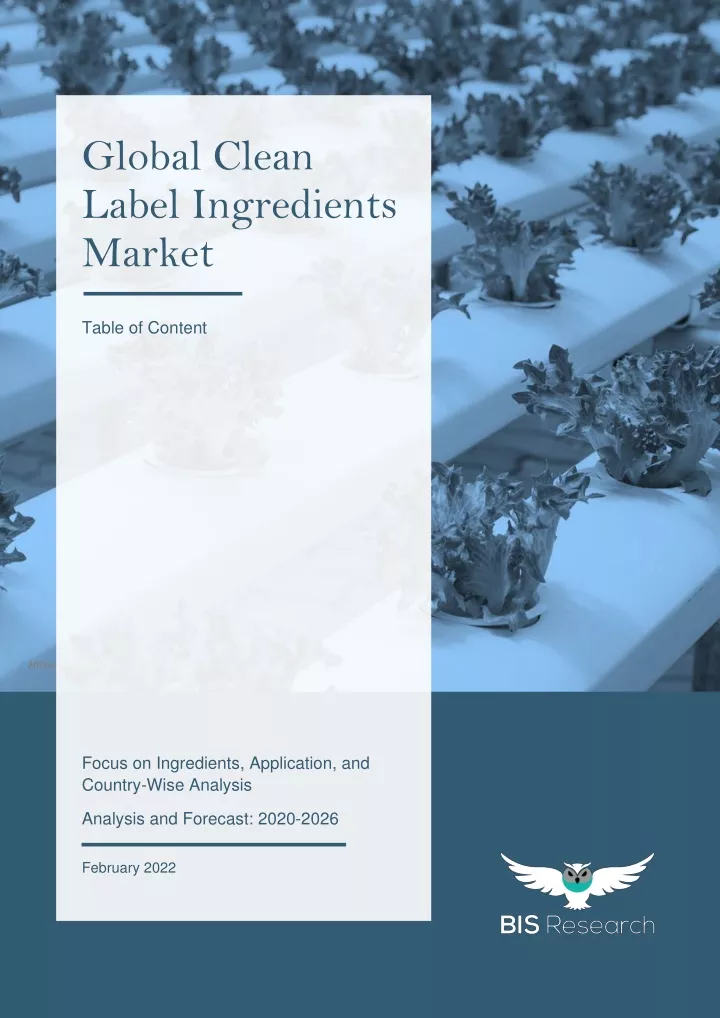
Global Clean Label Ingredients Market Table of Content GLOBAL CLEAN LABEL INGREDIENTS MARKET Attribution: Please Provide Link of the Source. Focus on Ingredients, Application, and Country-Wise Analysis Analysis and Forecast: 2020-2026 February 2022 1 All rights reserved at BIS Research Inc.
BIS Research is a leading market intelligence and technology research company. BIS Research publishes in- depth market intelligence reports focusing on the market estimations, technology analysis, emerging high- growth applications, deeply segmented granular country-level market data and other important market parameters useful in the strategic decision making for senior management. BIS Research provides multi-client reports, company profiles, databases, and custom research services. GLOBAL CLEAN LABEL INGREDIENTS MARKET Copyright © 2022 BIS Research Inc. All Rights Reserved. This document contains highly confidential information and is the sole property of BIS Research. Disclosing, copying, circulating, quoting or otherwise reproducing any or all contents of this document is strictly prohibited. Access to this information is provided exclusively for the benefit of the people or organization concerned. It may not be accessed by or offered whether for sale or otherwise to any third party. 2 All rights reserved at BIS Research Inc.
Table of Content Executive Summary .......................................................................... 27 1 Markets ..................................................................................... 35 1.1 Industry Outlook .............................................................................................. 36 1.1.1Market Definition ......................................................................................... 36 1.1.2Supply Chain Network ................................................................................ 37 1.1.3Emerging Trends ......................................................................................... 39 1.1.4Consumer Insights ...................................................................................... 40 1.1.5Patent Analysis ............................................................................................ 41 1.1.5.1 Patent Analysis (by Status) ................................................................................ 42 1.1.5.2 Patents Analysis (by Year and Status) .............................................................. 43 1.1.5.3 Patents Analysis (by Organization) .................................................................... 43 1.2 Business Dynamics ......................................................................................... 44 1.2.1Business Drivers ......................................................................................... 44 1.2.1.1 Growing Demand for Transparency of Nutritional Labels .................................. 44 1.2.1.2 Significant Inclination for Organic Food ............................................................. 46 1.2.1.3 Health Issues Associated with Consumption of Artificial Food Additives .......... 46 1.2.2Business Challenges .................................................................................. 47 1.2.2.1 High Price of Clean Products ............................................................................. 47 1.2.2.2 Supply-Demand Gap ......................................................................................... 48 GLOBAL CLEAN LABEL INGREDIENTS MARKET 1.2.3Business Strategies .................................................................................... 48 1.2.3.1 Market Development .......................................................................................... 49 1.2.3.1.1Product Launches .................................................................................................... 49 1.2.3.2 Business Expansion .......................................................................................... 50 1.2.4Corporate Strategies ................................................................................... 50 1.2.4.1 Acquisitions ........................................................................................................ 50 1.2.4.2 Partnerships ....................................................................................................... 51 1.2.4.3 Other Strategies ................................................................................................. 52 1.2.5Business Opportunities .............................................................................. 52 3 All rights reserved at BIS Research Inc.
1.2.5.1 Emerging Concept of Plant-Based Products ..................................................... 52 1.2.5.2 Awareness about the Health Benefits of Clean Label Products ........................ 53 1.2.6Impact of COVID-19 on the Global Clean Label Ingredients Market ....... 53 2 Application ................................................................................ 55 2.1 Global Clean Label Ingredients Market (by Application) .............................. 56 2.1.1Food .............................................................................................................. 56 2.1.1.1 Bakery and Confectionery ................................................................................. 57 2.1.1.2 Dairy .................................................................................................................. 57 2.1.1.3 Snacks ............................................................................................................... 58 2.1.1.4 Frozen Food ...................................................................................................... 58 2.1.2Beverages .................................................................................................... 58 2.2 Demand Analysis of Global Clean Label Ingredients Market (by Application) ...................................................................................................... 59 3 Products .................................................................................... 60 3.1 Global Clean Label Ingredients Market (by Ingredient Type) ....................... 61 3.1.1Baking Staples ............................................................................................. 61 3.1.2Emulsifiers ................................................................................................... 63 3.1.3Starch and Sweeteners ............................................................................... 64 3.1.4Food Colors and Flavors ............................................................................ 64 3.1.5Others ........................................................................................................... 65 GLOBAL CLEAN LABEL INGREDIENTS MARKET 3.2 Demand Analysis of Global Clean Label Ingredients Market (by Ingredient Type) ............................................................................................... 65 Region ....................................................................................... 66 4 4.1 North America .................................................................................................. 69 4.1.1Market ........................................................................................................... 69 4.1.1.1 Key Clean Label Ingredients Providers Operating in North America ................. 69 4.1.1.2 Business Drivers ................................................................................................ 70 4.1.1.3 Business Challenges ......................................................................................... 70 4.1.2Application ................................................................................................... 70 4.1.2.1 North America Clean Label Ingredients Market (by Application) ....................... 70 4 All rights reserved at BIS Research Inc.
4.1.3Product ......................................................................................................... 71 4.1.3.1 North America Clean Label Ingredients Market (by Ingredient Type) ................ 71 4.1.4North America (by Country) ....................................................................... 71 4.1.4.1 U.S. .................................................................................................................... 71 4.1.4.1.1Market ...................................................................................................................... 72 4.1.4.1.1.1Buyer Attributes ................................................................................................ 72 4.1.4.1.1.2Key Clean Label Ingredients Providers Operating in the U.S. ......................... 72 4.1.4.1.1.3Business Challenges ........................................................................................ 73 4.1.4.1.1.4Business Drivers ............................................................................................... 73 4.1.4.1.2Application ................................................................................................................ 73 4.1.4.1.2.1U.S. Clean Label Ingredients Market (by Application) ...................................... 73 4.1.4.1.3Product ..................................................................................................................... 74 4.1.4.1.3.1U.S. Clean Label Ingredients Market (by Ingredient Type) .............................. 74 4.1.4.2 Canada .............................................................................................................. 74 4.1.4.2.1Market ...................................................................................................................... 75 4.1.4.2.1.1Buyer Attributes ................................................................................................ 75 4.1.4.2.1.2Key Clean Label Ingredients Providers Operating in Canada .......................... 75 4.1.4.2.1.3Business Challenges ........................................................................................ 75 4.1.4.2.1.4Business Drivers ............................................................................................... 75 4.1.4.2.2Application ................................................................................................................ 76 GLOBAL CLEAN LABEL INGREDIENTS MARKET 4.1.4.2.2.1Canada Clean Label Ingredients Market (by Application) ................................ 76 4.1.4.2.3Product ..................................................................................................................... 76 4.1.4.2.3.1Canada Clean Label Ingredients Market (by Ingredient Type)......................... 76 4.1.4.3 Mexico ............................................................................................................... 77 4.1.4.3.1Market ...................................................................................................................... 77 4.1.4.3.1.1Buyer Attributes ................................................................................................ 77 4.1.4.3.1.2Key Clean Label Ingredients Providers Operating in Mexico ........................... 77 4.1.4.3.1.3Business Challenges ........................................................................................ 78 4.1.4.3.1.4Business Drivers ............................................................................................... 78 5 All rights reserved at BIS Research Inc.
4.1.4.3.2Application ................................................................................................................ 78 4.1.4.3.2.1Mexico Clean Label Ingredients Market (by Application) ................................. 78 4.1.4.3.3Product ..................................................................................................................... 79 4.1.4.3.3.1Mexico Clean Label Ingredients Market (by Ingredient Type) .......................... 79 4.2 Europe .............................................................................................................. 81 4.2.1Market ........................................................................................................... 81 4.2.1.1 Key Clean Label Ingredients Providers Operating in Europe ............................ 81 4.2.1.2 Business Drivers ................................................................................................ 82 4.2.1.3 Business Challenges ......................................................................................... 82 4.2.2Application ................................................................................................... 82 4.2.2.1 Europe Clean Label Ingredients Market (by Application) .................................. 82 4.2.3Product ......................................................................................................... 83 4.2.3.1 Europe Clean Label Ingredients Market (by Ingredient Type) ........................... 83 4.2.4Europe (by Country) .................................................................................... 83 4.2.4.1 Germany ............................................................................................................ 84 4.2.4.1.1Market ...................................................................................................................... 84 4.2.4.1.1.1Buyer Attributes ................................................................................................ 84 4.2.4.1.1.2Key Clean Label Ingredients Providers Operating in Germany........................ 84 4.2.4.1.1.3Business Challenges ........................................................................................ 84 4.2.4.1.1.4Business Drivers ............................................................................................... 84 GLOBAL CLEAN LABEL INGREDIENTS MARKET 4.2.4.1.2Application ................................................................................................................ 85 4.2.4.1.2.1Germany Clean Label Ingredients Market (by Application) .............................. 85 4.2.4.1.3Product ..................................................................................................................... 85 4.2.4.1.3.1Germany Clean Label Ingredients Market (by Ingredient Type) ...................... 85 4.2.4.2 France ................................................................................................................ 86 4.2.4.2.1Market ...................................................................................................................... 86 4.2.4.2.1.1Buyer Attributes ................................................................................................ 86 4.2.4.2.1.2Key Clean Label Ingredients Providers Operating in France ........................... 86 4.2.4.2.1.3Business Challenges ........................................................................................ 87 6 All rights reserved at BIS Research Inc.
4.2.4.2.1.4Business Drivers ............................................................................................... 87 4.2.4.2.2Application ................................................................................................................ 87 4.2.4.2.2.1France Clean Label Ingredients Market (by Application) ................................. 87 4.2.4.2.3Product ..................................................................................................................... 88 4.2.4.2.3.1France Clean Label Ingredients Market (by Ingredient Type) .......................... 88 4.2.4.3 Italy .................................................................................................................... 88 4.2.4.3.1Market ...................................................................................................................... 89 4.2.4.3.1.1Buyer Attributes ................................................................................................ 89 4.2.4.3.1.2Key Clean Label Ingredients Providers Operating in Italy ................................ 89 4.2.4.3.1.3Business Challenges ........................................................................................ 89 4.2.4.3.1.4Business Drivers ............................................................................................... 90 4.2.4.3.2Application ................................................................................................................ 90 4.2.4.3.2.1Italy Clean Label Ingredients Market (by Application) ...................................... 90 4.2.4.3.3Product ..................................................................................................................... 91 4.2.4.3.3.1Italy Clean Label Ingredients Market (by Ingredient Type) ............................... 91 4.2.4.4 Spain .................................................................................................................. 91 4.2.4.4.1Market ...................................................................................................................... 91 4.2.4.4.1.1Buyer Attributes ................................................................................................ 91 4.2.4.4.1.2Key Clean Label Ingredients Providers Operating in Spain ............................. 92 4.2.4.4.1.3Business Challenges ........................................................................................ 92 GLOBAL CLEAN LABEL INGREDIENTS MARKET 4.2.4.4.1.4Business Drivers ............................................................................................... 92 4.2.4.4.2Application ................................................................................................................ 92 4.2.4.4.2.1Spain Clean Label Ingredients Market (by Application) ................................... 92 4.2.4.4.3Product ..................................................................................................................... 93 4.2.4.4.3.1Spain Clean Label Ingredients Market (by Ingredient Type) ............................ 93 4.2.4.5 Rest-of-Europe .................................................................................................. 93 4.2.4.5.1Market ...................................................................................................................... 94 4.2.4.5.1.1Buyer Attributes ................................................................................................ 94 4.2.4.5.1.2Key Clean Label Ingredients Providers Operating in the Rest-of-Europe ........ 94 7 All rights reserved at BIS Research Inc.
4.2.4.5.1.3Business Challenges ........................................................................................ 94 4.2.4.5.1.4Business Drivers ............................................................................................... 95 4.2.4.5.2Application ................................................................................................................ 95 4.2.4.5.2.1Rest-of-Europe Clean Label Ingredients Market (by Application) .................... 95 4.2.4.5.3Product ..................................................................................................................... 96 4.2.4.5.3.1Rest-of-Europe Clean Label Ingredients Market (by Ingredient Type) ............. 96 4.3 Asia-Pacific and Japan .................................................................................... 98 4.3.1Market ........................................................................................................... 98 4.3.1.1 Key Clean Label Ingredients Providers in Asia-Pacific and Japan .................... 98 4.3.1.2 Business Drivers ................................................................................................ 98 4.3.1.3 Business Challenges ......................................................................................... 99 4.3.2Application ................................................................................................... 99 4.3.2.1 Asia-Pacific and Japan Clean Label Ingredients Market (by Application) ......... 99 4.3.3Product ....................................................................................................... 100 4.3.3.1 Asia-Pacific and Japan Clean Label Ingredients Market (by Ingredient Type) ................................................................................................................ 100 4.3.4Asia-Pacific and Japan (by Country) ....................................................... 100 4.3.4.1 Japan ............................................................................................................... 100 4.3.4.1.1Market .................................................................................................................... 101 4.3.4.1.1.1Buyer Attributes .............................................................................................. 101 GLOBAL CLEAN LABEL INGREDIENTS MARKET 4.3.4.1.1.2Key Clean Label Ingredients Providers Operating in Japan ........................... 101 4.3.4.1.1.3Business Challenges ...................................................................................... 101 4.3.4.1.1.4Business Drivers ............................................................................................. 102 4.3.4.1.2Application .............................................................................................................. 102 4.3.4.1.2.1Japan Clean Label Ingredients Market (by Application) ................................. 102 4.3.4.1.3Product ................................................................................................................... 103 4.3.4.1.3.1Japan Clean Label Ingredients Market (by Ingredient Type) ......................... 103 4.3.4.2 India ................................................................................................................. 103 4.3.4.2.1Market .................................................................................................................... 104 8 All rights reserved at BIS Research Inc.
4.3.4.2.1.1Buyer Attributes .............................................................................................. 104 4.3.4.2.1.2Key Clean Label Ingredients Providers Operating in India ............................. 104 4.3.4.2.1.3Business Challenges ...................................................................................... 104 4.3.4.2.1.4Business Drivers ............................................................................................. 104 4.3.4.2.2Application .............................................................................................................. 105 4.3.4.2.2.1India Clean Label Ingredients Market (by Application) ................................... 105 4.3.4.2.3Product ................................................................................................................... 105 4.3.4.2.3.1India Clean Label Ingredients Market (by Ingredient Type) ........................... 105 4.3.4.3 Rest-of-Asia-Pacific and Japan ....................................................................... 106 4.3.4.3.1Market .................................................................................................................... 106 4.3.4.3.1.1Buyer Attributes .............................................................................................. 106 4.3.4.3.1.2Key Clean Label Ingredients Providers Operating in the Rest-of-Asia Pacific and Japan .................................................................................................. 106 4.3.4.3.1.3Business Challenges ...................................................................................... 108 4.3.4.3.1.4Business Drivers ............................................................................................. 108 4.3.4.3.2Application .............................................................................................................. 108 4.3.4.3.2.1Rest-of-Asia-Pacific and Japan Clean Label Ingredients Market (by Application) ............................................................................................................ 108 4.3.4.3.3Product ................................................................................................................... 109 4.3.4.3.3.1Rest-of-Asia-Pacific and Japan Clean Label Ingredients Market (by Ingredient Type) .................................................................................................... 109 GLOBAL CLEAN LABEL INGREDIENTS MARKET 4.4 China ............................................................................................................... 111 4.4.1Market ......................................................................................................... 111 4.4.1.1 Buyer Attributes ............................................................................................... 111 4.4.1.2 Key Clean Label Ingredients Providers Operating in China ............................ 111 4.4.1.3 Business Challenges ....................................................................................... 112 4.4.1.4 Business Drivers .............................................................................................. 112 4.4.2Application ................................................................................................. 112 4.4.2.1 China Clean Label Ingredients Market (by Application) ................................... 112 4.4.3Product ....................................................................................................... 113 9 All rights reserved at BIS Research Inc.
4.4.3.1 China Clean Label Ingredients Market (by Ingredient Type) ........................... 113 4.5 U.K. ................................................................................................................. 115 4.5.1Market ......................................................................................................... 115 4.5.1.1 Buyer Attributes ............................................................................................... 115 4.5.1.2 Key Clean Label Ingredients Providers in the U.K. .......................................... 115 4.5.1.3 Business Challenges ....................................................................................... 116 4.5.1.4 Business Drivers .............................................................................................. 116 4.5.2Application ................................................................................................. 116 4.5.2.1 U.K. Clean Label Ingredients Market (by Application) ..................................... 116 4.5.3Product ....................................................................................................... 117 4.5.3.1 U.K. Clean Label Ingredients Market (by Ingredient Type) .............................. 117 4.6 South America ............................................................................................... 119 4.6.1Market ......................................................................................................... 119 4.6.1.1 Key Clean Label Ingredients Providers in South America ............................... 119 4.6.1.2 Business Drivers .............................................................................................. 120 4.6.1.3 Business Challenges ....................................................................................... 120 4.6.2Application ................................................................................................. 120 4.6.2.1 South America Clean Label Ingredients Market (by Application) .................... 120 4.6.3Product ....................................................................................................... 121 4.6.3.1 South America Clean Label Ingredients Market (by Ingredient Type) ............. 121 GLOBAL CLEAN LABEL INGREDIENTS MARKET 4.6.4South America (by Country) ..................................................................... 121 4.6.4.1 Brazil ................................................................................................................ 121 4.6.4.1.1Market .................................................................................................................... 122 4.6.4.1.1.1Buyer Attributes .............................................................................................. 122 4.6.4.1.1.2Key Clean Label Ingredients Providers Operating in Brazil ........................... 122 4.6.4.1.1.3Business Challenges ...................................................................................... 122 4.6.4.1.1.4Business Drivers ............................................................................................. 123 4.6.4.1.2Application .............................................................................................................. 123 4.6.4.1.2.1Brazil Clean Label Ingredients Market (by Application) .................................. 123 10 All rights reserved at BIS Research Inc.
4.6.4.1.3Product ................................................................................................................... 124 4.6.4.1.3.1Brazil Clean Label Ingredients Market (by Ingredient Type) .......................... 124 4.6.4.2 Rest-of-South America .................................................................................... 124 4.6.4.2.1Market .................................................................................................................... 124 4.6.4.2.1.1Buyer Attributes .............................................................................................. 124 4.6.4.2.1.2Key Clean Label Ingredients Providers Operating in the Rest-of-South America ................................................................................................................. 125 4.6.4.2.1.3Business Challenges ...................................................................................... 125 4.6.4.2.1.4Business Drivers ............................................................................................. 125 4.6.4.2.2Application .............................................................................................................. 125 4.6.4.2.2.1Rest-of-South America Clean Label Ingredients Market (by Application) ...... 125 4.6.4.2.3Product ................................................................................................................... 126 4.6.4.2.3.1Rest-of-South America Clean Label Ingredients Market (by Ingredient Type) ..................................................................................................................... 126 4.7 Middle East and Africa .................................................................................. 128 4.7.1Market ......................................................................................................... 128 4.7.1.1 Key Clean Label Ingredients Providers Operating in the Middle East and Africa ................................................................................................................ 128 4.7.1.2 Business Drivers .............................................................................................. 128 4.7.1.3 Business Challenges ....................................................................................... 129 4.7.2Application ................................................................................................. 129 GLOBAL CLEAN LABEL INGREDIENTS MARKET 4.7.2.1 Middle East and Africa Clean Label Ingredients Market (by Application) ........ 129 4.7.3Product ....................................................................................................... 130 4.7.3.1 Middle East and Africa Clean Label Ingredients Market (by Ingredient Type) ................................................................................................................ 130 4.7.4Middle East and Africa (by Country) ........................................................ 130 4.7.4.1 Middle East ...................................................................................................... 130 4.7.4.1.1Market .................................................................................................................... 131 4.7.4.1.1.1Buyer Attributes .............................................................................................. 131 4.7.4.1.1.2Key Clean Label Ingredients Providers Operating in the Middle East ........... 131 11 All rights reserved at BIS Research Inc.
4.7.4.1.1.3Business Challenges ...................................................................................... 132 4.7.4.1.1.4Business Drivers ............................................................................................. 132 4.7.4.1.2Application .............................................................................................................. 132 4.7.4.1.2.1Middle East Clean Label Ingredients Market (by Application) ........................ 132 4.7.4.1.3Product ................................................................................................................... 133 4.7.4.1.3.1Middle East Clean Label Ingredients Market (by Ingredient Type) ................ 133 4.7.4.2 Africa ................................................................................................................ 133 4.7.4.2.1Market .................................................................................................................... 134 4.7.4.2.1.1Buyer Attributes .............................................................................................. 134 4.7.4.2.1.2Key Clean Label Ingredients Providers Operating in Africa ........................... 134 4.7.4.2.1.3Business Challenges ...................................................................................... 134 4.7.4.2.1.4Business Drivers ............................................................................................. 134 4.7.4.2.2Application .............................................................................................................. 135 4.7.4.2.2.1Africa Clean Label Ingredients Market (by Application) ................................. 135 4.7.4.2.3Product ................................................................................................................... 135 4.7.4.2.3.1Africa Clean Label Ingredients Market (by Ingredient Type) .......................... 135 5 Markets - Competitive Benchmarking and Company Profiles .... 136 5.1 Competitive Benchmarking .......................................................................... 137 5.2 Market Share Analysis .................................................................................. 139 5.3 Company Profile ............................................................................................ 141 GLOBAL CLEAN LABEL INGREDIENTS MARKET 5.3.1Clean Label Ingredients Providers ........................................................... 141 5.3.1.1 Archer-Daniels-Midland Company ................................................................... 141 5.3.1.1.1Company Overview ................................................................................................ 141 5.3.1.1.1.1Role of Archer-Daniels-Midland Company in the Global Clean Label Ingredients Market ................................................................................................ 141 5.3.1.1.1.2Product Portfolio ............................................................................................. 142 5.3.1.1.2Business Strategies ............................................................................................... 142 5.3.1.1.2.1Product Development ..................................................................................... 142 5.3.1.1.3Corporate Strategies .............................................................................................. 142 12 All rights reserved at BIS Research Inc.
5.3.1.1.3.1Mergers and Acquisitions ............................................................................... 142 5.3.1.1.3.2Partnerships, Joint Ventures, Collaborations, and Alliances .......................... 143 5.3.1.1.4Strengths and Weaknesses of Archer-Daniels-Midland Company ........................ 144 5.3.1.2 Beneo .............................................................................................................. 145 5.3.1.2.1Company Overview ................................................................................................ 145 5.3.1.2.1.1Role of Beneo in the Global Clean Label Ingredients Market ........................ 145 5.3.1.2.1.2Product Portfolio ............................................................................................. 146 5.3.1.2.2Business Strategies ............................................................................................... 146 5.3.1.2.2.1Product Development ..................................................................................... 146 5.3.1.2.2.2Investment Strategies ..................................................................................... 146 5.3.1.2.3Strengths and Weaknesses of Beneo ................................................................... 147 5.3.1.3 Brisan Group .................................................................................................... 148 5.3.1.3.1Company Overview ................................................................................................ 148 5.3.1.3.1.1Role of Brisan Group in the Global Clean Label Ingredients Market ............. 148 5.3.1.3.1.2Product Portfolio ............................................................................................. 148 5.3.1.3.2Strengths and Weaknesses of Brisan Group ......................................................... 149 5.3.1.4 Cargill, Incorporated ........................................................................................ 150 5.3.1.4.1Company Overview ................................................................................................ 150 5.3.1.4.1.1Role of Cargill, Incorporated in the Global Clean Label Ingredients Market ................................................................................................................... 150 GLOBAL CLEAN LABEL INGREDIENTS MARKET 5.3.1.4.1.2Product Portfolio ............................................................................................. 151 5.3.1.4.2Business Strategies ............................................................................................... 151 5.3.1.4.2.1Product Development ..................................................................................... 151 5.3.1.4.3Corporate Strategies .............................................................................................. 151 5.3.1.4.3.1Mergers and Acquisitions ............................................................................... 151 5.3.1.4.3.2Partnerships, Joint Ventures, Collaborations, and Alliances .......................... 152 5.3.1.4.4Strengths and Weaknesses of Cargill, Incorporated ............................................. 152 5.3.1.5 Chr. Hansen A/S .............................................................................................. 153 5.3.1.5.1Company Overview ................................................................................................ 153 13 All rights reserved at BIS Research Inc.
5.3.1.5.1.1Role of Chr. Hansen A/S in the Global Clean Label Ingredients Market ........ 153 5.3.1.5.1.2Product Portfolio ............................................................................................. 154 5.3.1.5.2Business Strategies ............................................................................................... 154 5.3.1.5.2.1Product Development ..................................................................................... 154 5.3.1.5.3Corporate Strategies .............................................................................................. 155 5.3.1.5.3.1Mergers and Acquisitions ............................................................................... 155 5.3.1.5.3.2Partnerships, Joint Ventures, Collaborations, and Alliances .......................... 155 5.3.1.5.3.3Rebranding Strategies .................................................................................... 155 5.3.1.5.4Strengths and Weaknesses of Chr. Hansen A/S ................................................... 156 5.3.1.6 Corbion ............................................................................................................ 157 5.3.1.6.1Company Overview ................................................................................................ 157 5.3.1.6.1.1Role of Corbion in the Global Clean Label Ingredients Market ...................... 157 5.3.1.6.1.2Product Portfolio ............................................................................................. 158 5.3.1.6.2Business Strategies ............................................................................................... 158 5.3.1.6.2.1Product Development ..................................................................................... 158 5.3.1.6.3Corporate Strategies .............................................................................................. 159 5.3.1.6.3.1Mergers and Acquisitions ............................................................................... 159 5.3.1.6.3.2Partnerships, Joint Ventures, Collaborations, and Alliances .......................... 159 5.3.1.6.3.3Certification and Business Expansion ............................................................ 159 5.3.1.6.4Strengths and Weaknesses of Corbion ................................................................. 160 GLOBAL CLEAN LABEL INGREDIENTS MARKET 5.3.1.7 DuPont ............................................................................................................. 161 5.3.1.7.1Company Overview ................................................................................................ 161 5.3.1.7.1.1Role of DuPont in the Global Clean Label Ingredients Market ....................... 161 5.3.1.7.1.2Product Portfolio ............................................................................................. 162 5.3.1.7.2Business Strategies ............................................................................................... 162 5.3.1.7.2.1Product Development ..................................................................................... 162 5.3.1.7.3Corporate Strategies .............................................................................................. 163 5.3.1.7.3.1Mergers and Acquisitions ............................................................................... 163 5.3.1.7.3.2Business Expansion ....................................................................................... 163 14 All rights reserved at BIS Research Inc.
5.3.1.7.4Strengths and Weaknesses of DuPont .................................................................. 163 5.3.1.8 Frutarom .......................................................................................................... 164 5.3.1.8.1Company Overview ................................................................................................ 164 5.3.1.8.1.1Role of Frutarom in the Global Clean Label Ingredients Market .................... 164 5.3.1.8.1.2Product Portfolio ............................................................................................. 164 5.3.1.8.2Business Strategies ............................................................................................... 165 5.3.1.8.2.1Product Development ..................................................................................... 165 5.3.1.8.3Strengths and Weaknesses of Frutarom ............................................................... 165 5.3.1.9 Givaudan ......................................................................................................... 166 5.3.1.9.1Company Overview ................................................................................................ 166 5.3.1.9.1.1Role of Givaudan in the Global Clean Label Ingredients Market ................... 166 5.3.1.9.1.2Product Portfolio ............................................................................................. 167 5.3.1.9.2Business Strategies ............................................................................................... 167 5.3.1.9.2.1Product Development ..................................................................................... 167 5.3.1.9.3Corporate Strategies .............................................................................................. 167 5.3.1.9.3.1Mergers and Acquisitions ............................................................................... 167 5.3.1.9.3.2Partnerships, Joint Ventures, Collaborations, and Alliances .......................... 168 5.3.1.9.4Strengths and Weaknesses of Givaudan .............................................................. 168 5.3.1.10 Groupe Limagrain ............................................................................................ 169 5.3.1.10.1Company Overview ................................................................................................ 169 GLOBAL CLEAN LABEL INGREDIENTS MARKET 5.3.1.10.1.1Role of Groupe Limagrain in the Global Clean Label Ingredients Market ...... 169 5.3.1.10.1.2Product Portfolio ............................................................................................. 170 5.3.1.10.2Business Strategies ............................................................................................... 170 5.3.1.10.2.1Product Development ..................................................................................... 170 5.3.1.10.2.2Business Expansion ....................................................................................... 170 5.3.1.10.3Strengths and Weaknesses of Groupe Limagrain ................................................. 171 5.3.1.11 Ingredion Incorporated ..................................................................................... 172 5.3.1.11.1Company Overview ................................................................................................ 172 15 All rights reserved at BIS Research Inc.
5.3.1.11.1.1Role of Ingredion Incorporated in the Global Clean Label Ingredients Market ................................................................................................................... 172 5.3.1.11.1.2Product Portfolio ............................................................................................. 173 5.3.1.11.2Business Strategies ............................................................................................... 173 5.3.1.11.2.1Product Development ..................................................................................... 173 5.3.1.11.3Corporate Strategies .............................................................................................. 174 5.3.1.11.3.1Mergers and Acquisitions ............................................................................... 174 5.3.1.11.3.2Business Expansion ....................................................................................... 174 5.3.1.11.4Strengths and Weaknesses of Ingredion Incorporated ......................................... 175 5.3.1.12 Kerry Group ..................................................................................................... 176 5.3.1.12.1Company Overview ................................................................................................ 176 5.3.1.12.1.1Role of Kerry Group in the Global Clean Label Ingredients Market ............... 176 5.3.1.12.1.2Product Portfolio ............................................................................................. 177 5.3.1.12.2Corporate Strategies .............................................................................................. 177 5.3.1.12.2.1Mergers and Acquisitions ............................................................................... 177 5.3.1.12.3Strengths and Weaknesses of Kerry Group .......................................................... 178 5.3.1.13 DSM ................................................................................................................. 179 5.3.1.13.1Company Overview ................................................................................................ 179 5.3.1.13.1.1Role of DSM in the Global Clean Label Ingredients Market ........................... 179 5.3.1.13.1.2Product Portfolio ............................................................................................. 180 GLOBAL CLEAN LABEL INGREDIENTS MARKET 5.3.1.13.2Business Strategies ............................................................................................... 180 5.3.1.13.2.1Product Development ..................................................................................... 180 5.3.1.13.3Corporate Strategies .............................................................................................. 180 5.3.1.13.3.1Mergers and Acquisitions ............................................................................... 180 5.3.1.13.4Strengths and Weaknesses of DSM ...................................................................... 181 5.3.1.14 Sensient Technologies .................................................................................... 182 5.3.1.14.1Company Overview ................................................................................................ 182 5.3.1.14.1.1Role of Sensient Technologies in the Global Clean Label Ingredients Market ................................................................................................................... 182 5.3.1.14.1.2Product Portfolio ............................................................................................. 183 16 All rights reserved at BIS Research Inc.
5.3.1.14.2Corporate Strategies .............................................................................................. 183 5.3.1.14.2.1Mergers and Acquisitions ............................................................................... 183 5.3.1.14.3Strengths and Weaknesses of Sensient Technologies ......................................... 184 5.3.1.15 Tate & Lyle ....................................................................................................... 185 5.3.1.15.1Company Overview ................................................................................................ 185 5.3.1.15.1.1Role of Tate and Lyle in the Global Clean Label Ingredients Market ............. 185 5.3.1.15.1.2Product Portfolio ............................................................................................. 186 5.3.1.15.2Business Strategies ............................................................................................... 186 5.3.1.15.2.1Product Development ..................................................................................... 186 5.3.1.15.3Corporate Strategies .............................................................................................. 186 5.3.1.15.3.1Mergers and Acquisitions ............................................................................... 186 5.3.1.15.3.2Business Expansion ....................................................................................... 187 5.3.1.15.4Strengths and Weaknesses of Tate & Lyle ............................................................ 187 5.4 Company Profile (Food Processing) ............................................................ 188 5.4.1Clean Label Food Processing Companies .............................................. 188 5.4.1.1 Campbell’s ....................................................................................................... 188 5.4.1.1.1Company Overview ................................................................................................ 188 5.4.1.1.1.1Product Portfolio ............................................................................................. 188 5.4.1.1.1.2Key Development ........................................................................................... 189 5.4.1.2 Hain Celestial ................................................................................................... 190 GLOBAL CLEAN LABEL INGREDIENTS MARKET 5.4.1.2.1Company Overview ................................................................................................ 190 5.4.1.2.1.1Product Portfolio ............................................................................................. 190 5.4.1.2.1.2Key Development ........................................................................................... 191 5.4.1.3 Kellogg’s Company .......................................................................................... 192 5.4.1.3.1Company Overview ................................................................................................ 192 5.4.1.3.1.1Product Portfolio ............................................................................................. 192 5.4.1.3.1.2Key Development ........................................................................................... 193 5.4.1.4 Mondelez ......................................................................................................... 194 5.4.1.4.1Company Overview ................................................................................................ 194 17 All rights reserved at BIS Research Inc.
5.4.1.4.1.1Product Portfolio ............................................................................................. 194 5.4.1.4.1.2Key Development ........................................................................................... 195 5.4.1.5 Nestlé ............................................................................................................... 196 5.4.1.5.1Company Overview ................................................................................................ 196 5.4.1.5.1.1Product Portfolio ............................................................................................. 196 5.4.1.5.1.2Key Development ........................................................................................... 197 5.4.1.6 Organic India ................................................................................................... 198 5.4.1.6.1Company Overview ................................................................................................ 198 5.4.1.6.1.1Product Portfolio ............................................................................................. 198 5.4.1.6.1.2Key Development ........................................................................................... 198 5.4.1.7 Panera Bread ................................................................................................... 199 5.4.1.7.1Company Overview ................................................................................................ 199 5.4.1.7.1.1Product Portfolio ............................................................................................. 199 5.4.1.7.1.2Key Development ........................................................................................... 200 5.4.1.8 Snyder’s of Hanover ........................................................................................ 201 5.4.1.8.1Company Overview ................................................................................................ 201 5.4.1.8.1.1Product Portfolio ............................................................................................. 201 5.4.1.8.1.2Key Development ........................................................................................... 202 5.4.1.9 SUJA LIFE, LLC .............................................................................................. 203 5.4.1.9.1Company Overview ................................................................................................ 203 GLOBAL CLEAN LABEL INGREDIENTS MARKET 5.4.1.9.1.1Product Portfolio ............................................................................................. 203 5.4.1.10 Tetra Pak ......................................................................................................... 204 5.4.1.10.1Company Overview ................................................................................................ 204 5.4.1.10.1.1Product Portfolio ............................................................................................. 204 5.4.1.10.1.2Key Development ........................................................................................... 204 6 Research Methodology ............................................................. 207 6.1 Data Sources .................................................................................................. 207 6.1.1Primary Data Sources ............................................................................... 207 6.1.2Secondary Data Sources .......................................................................... 207 18 All rights reserved at BIS Research Inc.
6.1.3Data Triangulation ..................................................................................... 208 6.2 Market Estimation and Forecast ................................................................... 209 6.2.1Factors for Data Prediction and Modelling ............................................. 210 GLOBAL CLEAN LABEL INGREDIENTS MARKET 19 All rights reserved at BIS Research Inc.
List of Figures Figure 1: Global Clean Label Ingredients Market, $Billion, 2020-2026 Figure 2: Global Clean Label Ingredients Market Dynamics Figure 3: Global Clean Label Ingredients Market (by Application), $Billion, 2020, 2021 and 2026 Figure 4: Global Clean Label Ingredients Market (by Food), $Billion, 2020, 2021 and 2026 Figure 5: Global Clean Label Ingredients Market (by Ingredient Type), $Billion, 2020, 2021 and 2026 Figure 6: Global Clean Label Ingredients Market (by Region), $Billion, 2020 Figure 7: Global Clean Label Ingredients Market Coverage Figure 8: Global Clean Label Ingredients Market Attributes Figure 9: Supply Chain Analysis of the Global Clean Label Ingredients Market Figure 10: Importance of Clean Label Claim by Income and Generation Figure 11: Clean Label Product Preference Share (%) Among Consumers, 2020 Figure 12: Total Number of Patents for the Global Clean Label Ingredients Market, January 2017- October 2021 Figure 13: Patent Analysis (by Status), January 2017-October 2021 Figure 14: Total Patents Filed or Granted for the Global Clean Label Ingredients Market, January 2017- October 2021 Figure 15: Patents Analysis (by Organization), January 2017-October 2021 Figure 16: Consumer Opinion on Product Transparency, 2021 Figure 17: Consumer Expectancy on Product Transparency, 2021 Figure 18: Share of Key Market Strategies and Developments, January 2019– December 2021 GLOBAL CLEAN LABEL INGREDIENTS MARKET Figure 19: Acquisitions (by Company), January 2019-May 2021 Figure 20: Partnerships (by Company), January 2019–December 2021 Figure 21: Global Clean Label Ingredients Market (by Application) Figure 22: Global Clean Label Ingredients Market (by Ingredient Type) Figure 23: Competitive Benchmarking: High and Low Matrix Figure 24: Market Share Analysis of Clean Label Ingredients Providing Companies, 2020 Figure 25: Data Triangulation Figure 26: Top-Down and Bottom-Up Approach Figure 27: Assumptions and Limitations 20 All rights reserved at BIS Research Inc.
List of Tables Table 1: Growth of New Food and Beverages Launched with Clean Ingredients Claims, (by Region), 2017-2019 Table 2: Total Number of Patents by Leading Companies, January 2017 October 2021 Table 3: Product Launches (by Company) Table 4: Global Clean Label Ingredients Market (by Application), $Million, 2020-2026 Table 5: Global Clean Label Ingredients Market (by Food), $Million, 2020-2026 Table 6: Types of Baking Staple and Formulation Process Table 7: Types of Emulsifiers and their Application Rates Table 8: Global Clean Label Ingredients Market (by Ingredient Type), $Million, 2020-2026 Table 9: Global Clean Label Ingredients Market (by Region), $Million, 2020-2026 Table 10: North America Clean Label Ingredients Market (by Application), $Million, 2020-2026 Table 11: North America Clean Label Ingredients Market (by Food), $Million, 2020-2026 Table 12: North America Clean Label Ingredients Market (by Ingredient Type), $Million, 2020-2026 Table 13: North America Clean Label Ingredients Market (by Country), $Million, 2020-2026 Table 14: U.S. Clean Label Ingredients Market (by Application), $Million, 2020-2026 Table 15: U.S. Clean Label Ingredients Market (by Food), $Million, 2020-2026 Table 16: U.S. Clean Label Ingredients Market (by Ingredient Type), $Million, 2020-2026 Table 17: Canada Clean Label Ingredients Market (by Application), $Million, 2020-2026 Table 18: Canada Clean Label Ingredients Market (by Food), $Million, 2020-2026 Table 19: Canada Clean Label Ingredients Market (by Ingredient Type), $Million, 2020-2026 GLOBAL CLEAN LABEL INGREDIENTS MARKET Table 20: Mexico Clean Label Ingredients Market (by Application), $Million, 2020-2026 Table 21: Mexico Clean Label Ingredients Market (by Food), $Million, 2020-2026 Table 22: Mexico Clean Label Ingredients Market (by Ingredient Type), $Million, 2020-2026 Table 23: Europe Clean Label Ingredients Market (by Application), $Million, 2020-2026 Table 24: Europe Clean Label Ingredients Market (by Food), $Million, 2020-2026 Table 25: Europe Clean Label Ingredients Market (by Ingredient Type), $Million, 2020-2026 Table 26: Europe Clean Label Ingredients Market (by Country), $Million, 2020-2026 Table 27: Germany Clean Label Ingredients Market (by Application), $Million, 2020-2026 Table 28: Germany Clean Label Ingredients Market (by Food), $Million, 2020-2026 Table 29: Germany Clean Label Ingredients Market (by Ingredient Type), $Million, 2020-2026 21 All rights reserved at BIS Research Inc.
Table 30: France Clean Label Ingredients Market (by Application), $Million, 2020-2026 Table 31: France Clean Label Ingredients Market (by Food), $Million, 2020-2026 Table 32: France Clean Label Ingredients Market (by Ingredient Type), $Million, 2020-2026 Table 33: Italy Clean Label Ingredients Market (by Application), $Million, 2020-2026 Table 34: Italy Clean Label Ingredients Market (by Food), $Million, 2020-2026 Table 35: Italy Clean Label Ingredients Market (by Ingredient Type), $Million, 2020-2026 Table 36: Spain Clean Label Ingredients Market (by Application), $Million, 2020-2026 Table 37: Spain Clean Label Ingredients Market (by Food), $Million, 2020-2026 Table 38: Spain Clean Label Ingredients Market (by Ingredient Type), $Million, 2020-2026 Table 39: Rest-of-Europe Clean Label Ingredients Market (by Application), $Million, 2020-2026 Table 40: Rest-of-Europe Clean Label Ingredients Market (by Food), $Million, 2020-2026 Table 41: Rest-of-Europe Clean Label Ingredients Market (by Ingredient Type), $Million, 2020-2026 Table 42: Asia-Pacific and Japan Clean Label Ingredients Market (by Application), $Million, 2020-2026 Table 43: Asia-Pacific and Japan Clean Label Ingredients Market (by Food), $Million, 2020-2026 Table 44: Asia-Pacific and Japan Clean Label Ingredients Market (by Ingredient Type), $Million, 2020- 2026 Table 45: Asia-Pacific and Japan Clean Label Ingredients Market (by Country), $Million, 2020-2026 Table 46: Japan Clean Label Ingredients Market (by Application), $Million, 2020-2026 Table 47: Japan Clean Label Ingredients Market (by Food), $Million, 2020-2026 Table 48: Japan Clean Label Ingredients Market (by Ingredient Type), $Million, 2020-2026 Table 49: India Clean Label Ingredients Market (by Application), $Million, 2020-2026 Table 50: India Clean Label Ingredients Market (by Food), $Million, 2020-2026 GLOBAL CLEAN LABEL INGREDIENTS MARKET Table 51: India Clean Label Ingredients Market (by Ingredient Type), $Million, 2020-2026 Table 52: Rest-of-Asia-Pacific and Japan Clean Label Ingredients Market (by Application), $Million, 2020-2026 Table 53: Rest-of-Asia-Pacific and Japan Clean Label Ingredients Market (by Food), $Million, 2020- 2026 Table 54: Rest-of-Asia-Pacific and Japan Clean Label Ingredients Market (by Ingredient Type), $Million, 2020-2026 Table 55: China Clean Label Ingredients Market (by Application), $Million, 2020-2026 Table 56: China Clean Label Ingredients Market (by Food), $Million, 2020-2026 Table 57: China Clean Label Ingredients Market (by Ingredient Type), $Million, 2020-2026 Table 58: U.K. Clean Label Ingredients Market (by Application), $Million, 2020-2026 22 All rights reserved at BIS Research Inc.
Table 59: U.K. Clean Label Ingredients Market (by Food), $Million, 2020-2026 Table 60: U.K. Clean Label Ingredients Market (by Ingredient Type), $Million, 2020-2026 Table 61: South America Clean Label Ingredients Market (by Application), $Million, 2020-2026 Table 62: South America Clean Label Ingredients Market (by Food), $Million, 2020-2026 Table 63: South America Clean Label Ingredients Market (by Ingredient Type), $Million, 2020-2026 Table 64: South America Clean Label Ingredients Market (by Country), $Million, 2020-2026 Table 65: Brazil Clean Label Ingredients Market (by Application), $Million, 2020-2026 Table 66: Brazil Clean Label Ingredients Market (by Food), $Million, 2020-2026 Table 67: Brazil Clean Label Ingredients Market (by Ingredient Type), $Million, 2020-2026 Table 68: Rest-of-South America Clean Label Ingredients Market (by Application), $Million, 2020-2026 Table 69: Rest-of-South America Clean Label Ingredients Market (by Food), $Million, 2020-2026 Table 70: Rest-of-South America Clean Label Ingredients Market (by Ingredient Type), $Million, 2020- 2026 Table 71: Middle East and Africa Clean Label Ingredients Market (by Application), $Million, 2020-2026 Table 72: Middle East and Africa Clean Label Ingredients Market (by Food), $Million, 2020-2026 Table 73: Middle East and Africa Clean Label Ingredients Market (by Ingredient Type), $Million, 2020- 2026 Table 74: Middle East and Africa Clean Label Ingredients Market (by Country), $Million, 2020-2026 Table 75: Middle East Clean Label Ingredients Market (by Application), $Million, 2020-2026 Table 76: Middle East Clean Label Ingredients Market (by Food), $Million, 2020-2026 Table 77: Middle East Clean Label Ingredients Market (by Ingredient Type), $Million, 2020-2026 Table 78: Africa Clean Label Ingredients Market (by Application), $Million, 2020-2026 GLOBAL CLEAN LABEL INGREDIENTS MARKET Table 79: Africa Clean Label Ingredients Market (by Food), $Million, 2020-2026 Table 80: Africa Clean Label Ingredients Market (by Ingredient Type), $Million, 2020-2026 Table 81: Archer-Daniels-Midland Company: Product Portfolio Table 82: Archer-Daniels-Midland Company: Product Development Table 83: Archer-Daniels-Midland Company: Mergers and Acquisitions Table 84: Archer-Daniels-Midland Company: Partnerships, Joint Ventures, Collaborations, and Alliances Table 85: Beneo: Product Portfolio Table 86: Beneo: Product Development Table 87: Beneo: Investment Table 88: Brisan Group: Product Portfolio 23 All rights reserved at BIS Research Inc.
Table 89: Cargill, Incorporated: Product Portfolio Table 90: Cargill, Incorporated: Product Development Table 91: Cargill, Incorporated: Mergers and Acquisitions Table 92: Cargill, Incorporated: Partnership Joint Ventures, Collaborations, and Alliances Table 93: Chr. Hansen A/S: Product Portfolio Table 94: Chr. Hansen A/S: Product Development Table 95: Chr. Hansen A/S: Mergers and Acquisitions Table 96: Chr. Hansen A/S: Partnerships, Joint Ventures, Collaborations, and Alliances Table 97: Chr. Hansen A/S: Rebranding Table 98: Corbion: Product Portfolio Table 99: Corbion: Product Development Table 100: Corbion: Mergers and Acquisitions Table 101: Corbion: Partnerships, Joint Ventures, Collaborations, and Alliances Table 102: Corbion: Certification and Business Expansion Table 103: DuPont: Product Portfolio Table 104: DuPont: Product Development Table 105: DuPont: Mergers and Acquisitions Table 106: DuPont: Business Expansion Table 107: Frutarom: Product Portfolio Table 108: Frutarom: Product Development Table 109: Givaudan: Product Portfolio Table 110: Givaudan: Product Development GLOBAL CLEAN LABEL INGREDIENTS MARKET Table 111: Givaudan: Mergers and Acquisitions Table 112: Givaudan: Partnership and Collaboration Table 113: Groupe Limagrain: Product Portfolio Table 114: Product Development Table 115: Groupe Limagrain: Business Expansion Table 116: Ingredion Incorporated: Product Portfolio Table 117: Ingredion Incorporated: Product Development Table 118: Ingredion Incorporated: Mergers and Acquisitions Table 119: Ingredion Incorporated: Business Expansion Table 120: Kerry Group: Product Portfolio 24 All rights reserved at BIS Research Inc.
Table 121: Kerry Group: Mergers and Acquisitions Table 122: DSM: Product Portfolio Table 123: DSM: Product Development Table 124: DSM: Mergers and Acquisitions Table 125: Sensient Technologies: Product Portfolio Table 126: Sensient Technologies: Mergers and Acquisitions Table 127: Tate & Lyle: Product Portfolio Table 128: Tate & Lyle: Product Development Table 129: Tate & Lyle: Mergers and Acquisitions Table 130: Tate & Lyle: Business Expansion Table 131: Campbell’s: Product Portfolio Table 132: Campbell’s: Key Development Table 133: Hain Celestial: Product Portfolio Table 134: Hain Celestial: Key Development Table 135: Kellogg’s Company: Product Portfolio Table 136: Kellogg’s Company: Key Development Table 137: Mondelez: Product Portfolio Table 138: Mondelez: Key Development Table 139: Nestlé: Product Portfolio Table 140: Nestlé: Key Development Table 141: Organic India: Product Portfolio Table 142: Organic India: Key Development GLOBAL CLEAN LABEL INGREDIENTS MARKET Table 143: Panera Bread: Product Portfolio Table 144: Panera Bread: Key Development Table 145: Snyder’s of Hanover: Product Portfolio Table 146: Snyder’s of Hanover: Key Development Table 147: SUJA LIFE, LLC: Product Portfolio Table 148: Tetra Pak: Product Portfolio Table 149: Tetra Pak: Key Development Table 150: List of Other Companies Offering Clean Label Ingredients 25 All rights reserved at BIS Research Inc.
BIS Research Offerings: We are on a mission to harness the potential of disruptive technologies to make businesses thrive in today’s digital age. We have a vision to be a leading and a preferred knowledge partner for corporates and institutions worldwide and assist them with market intelligence in the area of emerging technologies, advisories, and other innovative solutions. Know More Know More Know More GLOBAL CLEAN LABEL INGREDIENTS MARKET Know More 26 All rights reserved at BIS Research Inc.
Disclaimer BIS Research Inc. provides valuable market intelligence to an exclusive group of customers in response to orders. The report is licensed for the customer's internal use only and is subject to restrictions set henceforth. This document and its contents are confidential and may not be further distributed, published, or reproduced, in whole or in part, by any medium or in any form for any purpose, without the express written consent of BIS Research Inc. Customer will not disclose the contents of the report, whether directly in any media or indirectly through incorporation in a database, marketing list, report or otherwise, or use or permit the use of Information to generate any statistical or other information that is or will be provided to third parties; or voluntarily produce Information in legal proceedings. Market reports are based on expectations, estimates, and projections as of the date such information is available. Any recommendation contained in this report may not be suitable for all investors or businesses. The market conclusions drawn are necessarily based upon a number of estimates and assumptions that, while considered reasonable by BIS Research Inc. as of the date of such statements, are inherently subject to market fluctuations and business, economic and competitive uncertainties and contingencies. For more details regarding permission, please contact us: Email: sales@bisresearch.com Tel: +1 510 404 8135 GLOBAL CLEAN LABEL INGREDIENTS MARKET 27 All rights reserved at BIS Research Inc.
BIS RESEARCH INC. GLOBAL CLEAN LABEL INGREDIENTS MARKET 39111 Paseo Padre PKWY, Suite 313 Fremont, CA 94538 -1686 E-mail: hello@bisresearch.com | Call Us: +1-510-404-8135 Global Delivery Center Tower B First Floor, Tapasya Corporate Heights, Greater Noida Expressway, Sector 126, Noida, U.P., 201303, India Tel: +91 120 4261540 / 4261544 28 www.bisresearch.com All rights reserved at BIS Research Inc.