Download
1 / 30
300 likes | 387 Vues
Chapter 4 Markets in Action: Government Participation. Price Floors/Ceilings Tariffs/Quotas Sales Taxes. Welfare Analysis. Consumer and Producer Surplus. Welfare Analysis. To determine the impact on trade policies, we must determine how the participants in the economy are affected

E N D
Chapter 4Markets in Action: Government Participation Price Floors/Ceilings Tariffs/Quotas Sales Taxes
Welfare Analysis Consumer and Producer Surplus
Welfare Analysis • To determine the impact on trade policies, we must determine how the participants in the economy are affected • Participants include: • Consumers (Households) • Producers (Firms) • Government
Consumer Surplus • Consumer Surplus (CS) is a method to determine the net benefit of consumption • Definition: “extra amount consumers are willing to pay for an item compared to what they have to pay” • Graphically, this is the area under the demand curve
Area under demand curve is the total value of consumption At $10, value to consumer is (a+b+c), but consumer must pay (b+c) So CS = a Consumer Surplus II P 15 a a 10 b b d 5 c e c D 0 Q 15 10
If the price falls to $5, then the total value of consumption is (a+b+c+d+e) Consumer must pay (c+e) So, CS= (a+b+d) Consumer Surplus III P 15 a a 10 b d b d 5 c e e c D Q 0 15 10
Producer Surplus (PS) • “Extra benefit” to producers • “What producers can charge” – “What producers willing to charge” • Graphically: Area between market price and supply curve
Suppose the market price is $5 Firm is willing to sell unit 8 at $5, but for units 1-7, the firm is willing to sell each at a price less than $8 PS = x Producer Surplus II P S 10 y z 5 x 1 0 15 8 Q
If the market price rises to $10, the firm is willing to sell at most 15 units. For units 1-14, the firm is willing to sell at a price lower than $10 PS = (x+y+z) Producer Surplus III P S 10 y z 5 x 1 0 15 8 Q
Market Equilibrium • A nation’s welfare can then be determined by the sum of consumer surplus (CS) and producer surplus (PS) (plus any government revenue) Welfare = CS + PS + GR • Note that an increase in market price decreases CS yet increases PS • So an increase in market price does not necessarily have a negative impact on the economy.
Government Intervention • What we have looked at before were cases where the "invisible hand" and market mechanism worked without interference from outside sources. • Lets look now at what happens when there is government intervention in the market
Government Intervention • Cases where governments (Federal, State, Local) intervene: • Price Ceilings • Price Floors • Sales Taxes • Tariffs • Quotas
Price Ceilings • Price Ceiling:A government regulation that limits how high a price can be charged for a good/service • 2 possible situations : 1) ceiling set above the equilibrium price 2) ceiling set below the equilibrium price Where do we see price ceilings in place?
Price Ceilings P S Ceilings create shortages P* Ceiling Price D Q
Price Floors Price Floors: A government regulation that limits how low a price may be charged for a good/service 2 possible situations : 1) ceiling set above the equilibrium price 2) ceiling set below the equilibrium price In what situations do we see price floors in place?
Price Floors P S Floor Price P* Floors Create Surpluses D Q
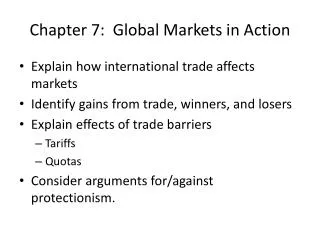
Quotas • Limit the quantity of imported goods that can enter a market • 2 possible scenarios 1) Binding quota (*) 2) Non-binding quota Why would the government ever use a quota rather than a tariff?
Quotas • Suppose the US autarky (no trade) price is $10.00. Suppose also that the price that the rest of the world pays is $5.00. • If the US begins to trade, its own firms will supply 5 units at $5.00, while demanding 20 units • This means the US must import 15 units
Quotas P S 10 5 Imports D Q 20 5 15
Quota • Suppose a quota is put in place that limits imports to 7 units. What will happen to: • US production 2) US consumption 3) Price US consumers pay
Quotas P S Under the quota, Consumers now pay $8 and import less 10 8 Quota 5 D Q 20 5 15 10 17
Sales Taxes While there are many different types of sales taxes, we will focus on a specific tax. A specific tax is a tax where for each unit of a good sold, a certain amount of money is paid to the government. One type of this tax is called an EXCISE TAX.
Taxes • NOTE: • Sellers (Producers) only receive the price that excludes the tax. • Buyers are faced with the price that includes the tax. • Taxes have thus driven a wedge between the prices.
TAX INCIDENCE • This is the idea concerning "who bears the burden of the tax." Is it always the consumer who pays the full price of the tax?? Scenarios: 1) Perfectly inelastic demand 2) Perfectly elastic demand 3) Perfectly elastic supply
Modeling Taxes • Suppose that a $10 per unit tax is placed on a good. The pre-tax price of the good is $25. Firms make supply decisions based on the price that they receive, not the price that we pay. Depending upon demand elasticity, consumers react by reducing the amount consumed. Depending upon supply elasticity, suppliers react by reducing the amount produced.
P S + Tax S 30 Tax raises price consumers pay, but also reduces the amount suppliers receive – tax burden shared Govnt. Rev. 25 20 D 0 Q 25 20
Taxes • In this case, the burden is shared. What happens to the burden of the tax if demand and supply elasticities are different?
P S + Tax S 33 GR 25 23 D Q 25 23
Taxes • What can we conclude from this??? • The more inelastic the demand and supply of a commodity, • the smaller the decline in output from a given tax. 2) Relative burden of taxation among buyers and sellers follows the "path of least resistance" ( i.e. tax is shifted in proportion to where inelasticity is greatest) 3) Where is government revenue the highest? To which goods does this relate?
Subsidies • Subsidies: a per unit payment on the purchase or sale of a commodity. Often called a “negative tax.” Purchase =====> consumption subsidy Sale =====> production subsidy