Download
1 / 42
430 likes | 562 Vues
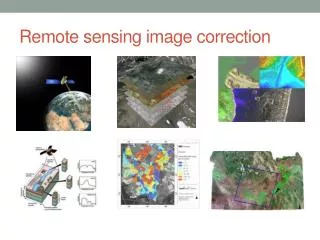
Remote Sensing, Image Interpretation, and Global Warming. OZONE. During which of the following time periods was the ozone hole the largest? How has the concentration and area of the ozone hole changed between 1979 and 1991?.

E N D
During which of the following time periods was the ozone hole the largest? How has the concentration and area of the ozone hole changed between 1979 and 1991?
3) Using the Images above and any additional information contained in all questions to determine what is thought to be the cause of a lowered ozone level?
As shown in the graphs, up until 1994, increasing amounts of chlorine and bromine were observed in the upper and lower atmosphere 4) What caused the increase in bromine in the upper and lower atmosphere? 5) Why have the levels of chlorine and bromine in the lower atmosphere decreased since 1994?
6) During which season are troposphere ozone levels highest in the United States? 7) Which Hemisphere has a greater concentration of troposphere ozone? 8) Explain why there is a need to decrease the levels of troposphere ozone. 9) What are the first four layers of the atmosphere from the group up?
10) How do gases such as carbon dioxide, methane, and chlorofluorocarbons contribute to global warming? 11) Which layer of the atmosphere is ther greatest concentration of atmospheric ozone found? 12) In which two ways have the ozone hole changed since 1979?
13) Contrast the level of carbon monoxide during April 9-19, 1994 and September 30 –October 11, 1994 in the Northern Hemisphere.
14) In what direction has the temperature trend in the West Antarctic ice sheet been over the part few decades? 15) Why are temperature trends so important? 16) Describe three impacts sea ice has on climate. 17) Which instrument is being used to measure the amount of sea ice?
18) During which month is sea ice most prevalent over the Northern Hemisphere?
19) Which color represents the warmest water temperatures? 20) Determine the latitude at which the Gulf Stream begins to cool.
21) Contrast the sea surface temperature in the southern Pacific during an El Nino in 1983 and on year later when the temperature is back to normal.
22) How much carbon (in billons of metric tons) is released to the atmosphere from the sea surface each year?
23) Which colors show the highest amounts of outgoing radiation? 24) Why is there a large different between the Northern and Southern Hemisphere? 25) Is there a greater amount of shortwave or long wave radiation shown for the northern polar region?
26) What percent of incoming solar radiation is absorbed by land and oceans? 27) The processes of evaporation and precipitation release what percent of long wave radiation? 28) What is the relationship between clouds and long wave radiation emitted from the Earths surface?
29) Define the “Greenhouse Effect” 30)Which is the most prevalent green house gas? 31) Atmospheric CO2 has increase by how much (ppm) since before the industrial revolution?
32) What can be said about the role cities play in CO2 given the above image.
Mt Pinatubo erupted in 1991 depositing ash into the atmosphere. 33) How would an eruption like Mt Pinatubo effect annual temperatures? 34) Why does the Mt Pinatubo ash tend to stay confined to the equatorial zone?
35) Define the term Anomaly. 36) Given the image above, what can be said about surface temperature anomalies over much of the northern polar regions? 37) Where do temperature anomalies appear more extreme: the equator or the poles?
38) The carbon dioxide curve shows regular oscillations (much like a sine curve). Why? 39) With what do these three curves best correlate?
41) Given the above image, what can be said about arctic ice cover? 42) What is the driving phenomena that brings about this change?
43) Comment on the patterns of ozone change you decipher from the above October sequence.
44) What parts of the above time-size plot are not especially favorable to satellite observations?
45) In the above diagram, there is one key element that is the potential "bottleneck" or rate-controlling process. Make a stab at what that component of the entire MPTE program might be, and why?
46) What is the difference between GOES and POES type satellites. 47) Name the satellites involved in the A-Train 48) Why is there a MODIS sensor on both Aqua and Terra platforms.
49) Which continent appears to be a) most widely vegetated; b) least widely?
50) What color is being used to identify the Rain Forest in this image?
Clearcutting of the mixed forest is in pinkish-red. Mature vegetation is darker green and regenerated forest appears in light green 51) Estimate the increase in clearcutting from 1984 to 1991 (by a factor of).
52) Can oil spills be detected in Landsat imagery? 53) Objects emit energy proportional to what? 54) Which type of satellite most likely gives you the cloud movement panorama you see in the nightly TV news?
55) Why is there a blocky disjointedness associated with this image?
Total Precipitable Water (in g/cc) as determined from SSM/I data, for September 3, 1987: 56) Why is the green in the above map where it is? 57) What is “SSM/I” an abbreviation for?
58) This is a classic portrayal of a hurricane's appearance. Deduce from the directions of motion implied by the swirls in the hurricane's spiral pattern which way the circulation (clockwise or counterclockwise) of the winds is taking place. 59) What is TRMM?
60) From the atmospheric absorption figure, list the four principal windows (by wavelength interval) open to effective remote sensing from above the atmosphere. 61) When evaluating clouds at night, what type of image (IR or visible) would you use and why?
62. Write down the Planck’s equation used in remote sensing? 63. What animal was originally used to take aerial photographs also known as some of the most primitive remote sensing images? 64. What type of satellites observe the Earth from the exact same place all the time? • What is the name given to the level of reflectivity of clouds in the atmosphere?
66. The lighter shades of this GOES image shows the water vapor over the continental US. What is the relationship between IR and water vapor?
67. See image above. Name the event that this image portrays and which year did this happen?