Download
1 / 1
10 likes | 133 Vues
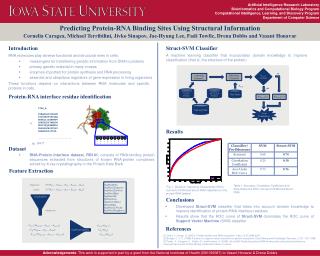
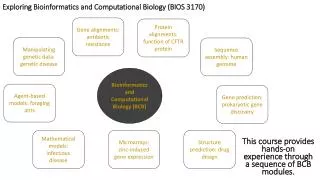
ISMB 2006. Artificial Intelligence Research Laboratory Bioinformatics and Computational Biology Program Computational Intelligence, Learning, and Discovery Program Department of Computer Science. On the Quality of Motifs for Protein Phosphorylation Site Prediction.

E N D
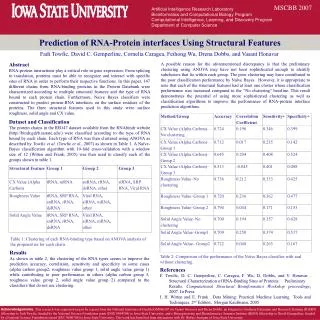
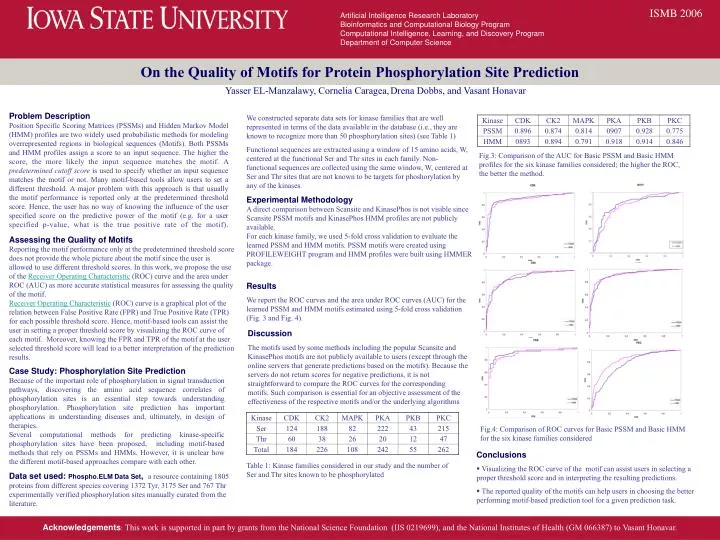
ISMB 2006 Artificial Intelligence Research Laboratory Bioinformatics and Computational Biology Program Computational Intelligence, Learning, and Discovery Program Department of Computer Science On the Quality of Motifs for Protein Phosphorylation Site Prediction Yasser EL-Manzalawy, Cornelia Caragea,Drena Dobbs, and Vasant Honavar Problem Description Position Specific Scoring Matrices (PSSMs) and Hidden Markov Model (HMM) profiles are two widely used probabilistic methods for modeling overrepresented regions in biological sequences (Motifs). Both PSSMs and HMM profiles assign a score to an input sequence. The higher the score, the more likely the input sequence matches the motif. A predetermined cutoff score is used to specify whether an input sequence matches the motif or not. Many motif-based tools allow users to set a different threshold. A major problem with this approach is that usually the motif performance is reported only at the predetermined threshold score. Hence, the user has no way of knowing the influence of the user specified score on the predictive power of the motif (e.g. for a user specified p-value, what is the true positive rate of the motif). We constructed separate data sets for kinase families that are well represented in terms of the data available in the database (i.e., they are known to recognize more than 50 phosphorylation sites) (see Table 1) Functional sequences are extracted using a window of 15 amino acids, W, centered at the functional Ser and Thr sites in each family. Non-functional sequences are collected using the same window, W, centered at Ser and Thr sites that are not known to be targets for phoshorylation by any of the kinases. Fig.3: Comparison of the AUC for Basic PSSM and Basic HMM profiles for the six kinase families considered; the higher the ROC, the better the method. Experimental Methodology A direct comparison between Scansite and KinasePhos is not visible since Scansite PSSM motifs and KinasePhos HMM profiles are not publicly available. For each kinase family, we used 5-fold cross validation to evaluate the learned PSSM and HMM motifs. PSSM motifs were created using PROFILEWEIGHT program and HMM profiles were built using HMMER package. Assessing the Quality of Motifs Reporting the motif performance only at the predetermined threshold score does not provide the whole picture about the motif since the user is allowed to use different threshold scores. In this work, we propose the use of the Receiver Operating Characteristic (ROC) curve and the area under ROC (AUC) as more accurate statistical measures for assessing the quality of the motif. Receiver Operating Characteristic (ROC) curve is a graphical plot of the relation between False Positive Rate (FPR) and True Positive Rate (TPR) for each possible threshold score. Hence, motif-based tools can assist the user in setting a proper threshold score by visualizing the ROC curve of each motif. Moreover, knowing the FPR and TPR of the motif at the user selected threshold score will lead to a better interpretation of the prediction results. Results We report the ROC curves and the area under ROC curves (AUC) for the learned PSSM and HMM motifs estimated using 5-fold cross validation (Fig. 3 and Fig. 4). Discussion The motifs used by some methods including the popular Scansite and KinasePhos motifs are not publicly available to users (except through the online servers that generate predictions based on the motifs). Because the servers do not return scores for negative predictions, it is not straightforward to compare the ROC curves for the corresponding motifs. Such comparison is essential for an objective assessment of the effectiveness of the respective motifs and/or the underlying algorithms Case Study: Phosphorylation Site Prediction Because of the important role of phosphorylation in signal transduction pathways, discovering the amino acid sequence correlates of phosphorylation sites is an essential step towards understanding phosphorylation. Phosphorylation site prediction has important applications in understanding diseases and, ultimately, in design of therapies. Several computational methods for predicting kinase-specific phosphorylation sites have been proposed, including motif-based methods that rely on PSSMs and HMMs. However, it is unclear how the different motif-based approaches compare with each other. Fig.4: Comparison of ROC curves for Basic PSSM and Basic HMM for the six kinase families considered • Conclusions • Visualizing the ROC curve of the motif can assist users in selecting a proper threshold score and in interpreting the resulting predictions. • The reported quality of the motifs can help users in choosing the better performing motif-based prediction tool for a given prediction task. Table 1: Kinase families considered in our study and the number of Ser and Thr sites known to be phosphorylated Data set used: Phospho.ELM Data Set, a resource containing 1805 proteins from different species covering 1372 Tyr, 3175 Ser and 767 Thr experimentally verified phosphorylation sites manually curated from the literature. Acknowledgements: This work is supported in part by grants from the National Science Foundation (IIS 0219699), and the National Institutes of Health (GM 066387) to Vasant Honavar.