Download
1 / 16
160 likes | 168 Vues
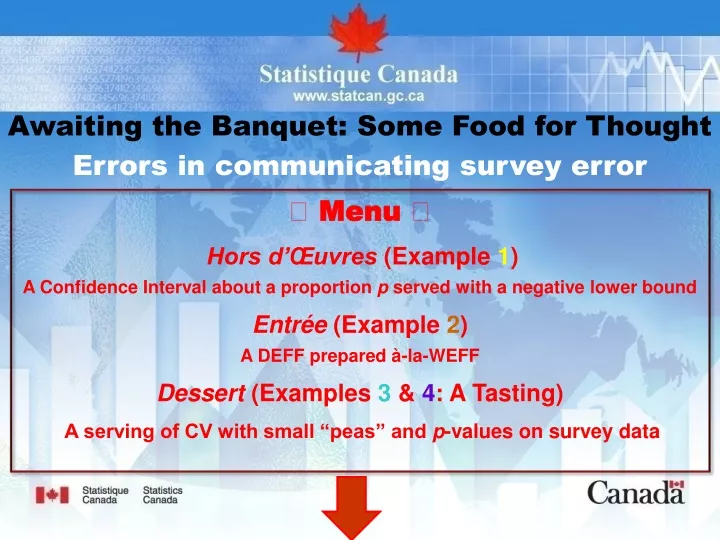
Awaiting the Banquet: Some Food for Thought Errors in communicating survey error. Menu Hors d’Œuvres ( Example 1 ) A Confidence Interval about a proportion p served with a negative lower bound Entrée ( Example 2 ) A DEFF prepared à-la-WEFF

E N D
Awaiting the Banquet: Some Food for Thought Errors in communicating survey error Menu Hors d’Œuvres (Example1) A Confidence Interval about a proportion p served with a negative lower bound Entrée (Example2) A DEFF prepared à-la-WEFF Dessert (Examples3 & 4: A Tasting) A serving of CV with small “peas” and p-values on survey data
A valid variance estimate is: useful, as it quantifies a significant portion of the survey errors; hard work to get (Think of variance estimation!); a tour de force: thanks to recent advances, the variance is tractable in survey situations of ever-growing complexity; not used directly as a quality indicator, but rather through: Coefficient of Variation (CV); Design EFFect (DEFF); Confidence Interval (CI); p-value; way too precious to be compromised by the way it gets reported! Errors in communicating survey error Statistique Canada • Statistics Canada
Four survey quality indicators: Coefficient of Variation (CV); Design EFFect (DEFF); Confidence Interval (CI); p-value. Four potential ways of ruining a valid variance estimate reporting it. Four such examples: Two copious servings and two tastings. Bon appétit! Errors in communicating survey error Statistique Canada • Statistics Canada
Example 1Confidence issues about a confidence interval • An analyst obtains the following Confidence Interval (CI) !!!??? about a true proportion pobtained using the “usual recipe” based on a SRSWOR s with n =100. • What he/she will typically do about this negative lower bound? • Nothing: “There is no issue here”; or • “Cosmetic” truncation, acknowledging that there is an issue (p ≥0 !!!) : Statistique Canada • Statistics Canada
Is doing nothing really an option? Yes, says the analyst: “What is the worst thing that can happen with this one CI? That it turns out to be ‘bad’ i.e., not to contain the true p? But Theory assures us that such bad CIs will be obtained. In fact, Theory says that 5% of all CIs we construct the usual way are bad! Is this one bad or not? Well, either way Theory backs us up.” Example 1Confidence issues about a confidence interval Statistique Canada • Statistics Canada
Example 1Confidence issues about a confidence interval Theerror rateof 5%claimed with the usual recipe is only valid if the Normality assumption (reasonably) holds, which mayormay not be the case: It is not some universal truth! 2.5% 2.5% Statistique Canada • Statistics Canada
Furthermore, Normality is not automatically transferred from the ideal statistic to the one statistic used in practice: A famous example: One also needs to converge (in probability) fastenough to V : Example 1Confidence issues about a confidence interval Statistique Canada • Statistics Canada
Example 2: A two-phase survey turning a DEFF into a WEFF U YU =? Two estimators for YU but just one estimate as the result of a calibration: sPhase1 Screened-in: Yes sPhase 2 Statistique Canada • Statistics Canada
The following Design EFFects (DEFFs) were computed for YU Example 2: A two-phase survey turning a DEFF into a WEFF • How can Phase 2 possibly be an improvement over Phase 1??? Statistique Canada • Statistics Canada
The calibration performed at Phase 2 ensures internal consistency within the whole survey. Calibration Same variance for both estimators: Nothing is lost aboutYU by going to Phase 2 but, more importantly, nothing is gained either! Same DEFF. Different DEFFs because the Phase 2 SRSWOR was denied the use of a calibration estimator for YU and thus had to fend for itself using only sPhase2 sPhase1: A WEFF was obtained. Example 2: A two-phase survey turning a DEFF into a WEFF Statistique Canada • Statistics Canada
What is a WEFF anyway? A DEFF conveys the relative efficiency of a complex sample design by comparing it to some basic design (e.g., SRSWOR). Thus, in computing a DEFF, only the design can change. A DEFF becomes a Whatever EFFect (WEFF) when other factors are allowed to change as well (without due consideration) e.g., the estimator used. Avoiding WEFFs is to avoid comparing apples to oranges. Other examples are given by Jack Gambino (a methodology director at Statistics Canada) in The American Statistician 2009. Example 2: A two-phase survey turning a DEFF into a WEFF Statistique Canada • Statistics Canada
CIs and DEFFs are not the sole culprits here: Issues also arise from reporting variance estimates using CVs and p-values. Reporting a CV in the case of a small proportion p: if estimates of p and (1-p) based on a SRSWOR s are to be regarded as equally (un-)reliable, then why Example 3: CVs and small proportions > Statistique Canada • Statistics Canada
Computing a p-value based on survey data using a classical statistics software can be done in one of several ways, such as By ignoring the design weights: What if the sample design is informative? By feeding then the weights in the software’s “weight” statement: Does the software “understand” that it is only dealing with n pieces of information and not (weights)=N,which overstates the power of the test? By feeding then the weights in a normalized form so that (weights_normalized) = n: What about the i.i.d. assumption (which is most likely violated by the sample design used)? Example 4:p-values and survey data Statistique Canada • Statistics Canada
What can be done to further raise awareness on the issue of reporting errors? Emphasize the role the variance plays as survey quality indicator Preserve its validity until released in one form or another! Urge practitioners to go back to fundamentals: Examine assumptions underlying existing methodologies; enquire about alternatives. Example: What about Bootstrap CIs? Warn practitioners against the indiscriminate use of software packages (including generalized systems) and the outputs they automatically spit out (CIs, DEFFs, etc.). Errors in communicating survey error: A discussion Statistique Canada • Statistics Canada
What can be done to further raise awareness on the issue of reporting errors? Promote critical review: If something looks too good to be true, then it probably is! Example: A sub-survey is improving on the main survey’s estimates (smaller DEFF) by actually losing data? This is plain wishful thinking! Extend a survey QA process to cover dissemination practices. Provide support: Access to technical committees; peer & expert reviews. Any thoughts / suggestions? Errors in communicating survey error: A discussion Statistique Canada • Statistics Canada
The poster Errors in Communicating Survey Error was brought to you by Claude Girard Senior Methodologist, Statistics Canada claude.girard@statcan.gc.ca Poster session - ITSEW 2014 Washington DC, October 2014