Download
1 / 19
190 likes | 375 Vues

E N D
1st INTERNATIONAL ASTRA CONFERENCE“ARE WE PREPARED TO COPE WITH CLIMATIC CHANGE?CONSEQUENCES OF THE WINTER STORM 2005”MAY 18-20, 2006Klaipeda (Lithuania)Consequences of the winter storm 2005 in Estonia; possible changes in mean and extreme sea levels due to climate changeÜlo Suursaar, Estonian Marine Institute, Univ. of Tartu(ASTRA - Are Kont group)
Structure of the presentation: • Gudrun (winter storm 2005) meteorology • Gudrun sea level • Hydrodynamic modelling of Gudrun impacts • Past sea level trends 1923-05 (aver., max, min) • Influence of climate change on sea level • Influence on hydrodynamic processes • Further sea level developments, return periods __________________________ * This on-line version is due to technical considerations a shorter version of the original 39-slide presentation, given at Klaipeda.
The presentation is based on published/submitted papers: Suursaar, Ü., Kullas, T., Otsmann, M., Saaremäe, I., Kuik, J., Merilain, M. 2006. Cyclone Gudrun in January 2005 and modelling its hydrodynamic consequences in the Estonian coastal waters. - Boreal Environment Res., 11, 2, 143-159. Suursaar, Ü., Jaagus, J., Kullas, T. 2006. Past and future changes in sea level near the Estonian coast in relation to changes in wind climate. - Boreal Environment Res., 11, 2, 123-142. [see: http://www.borenv.net]____________________ Tõnisson, H., Orviku, K., Jaagus, J., Suursaar, Ü., Kont, A., Rivis, R. 2006.Coastal Damages on Saaremaa Island, Estonia, Caused by the Extreme Storm and Flooding on January, 9 2005. – Journal of Coastal Research (submitted). Suursaar, Ü., Sooäär, J. 2006. Decadal variations in mean and extreme sea level values along the Estonian coast of the Baltic Sea. –Tellus A (submitted). Suursaar, Ü., Kullas, T. 2006. Influence of wind climate changes on mean sea level and current regime in the coastal waters of West Estonia, the Baltic Sea. – Oceanologia (submitted).
Windforcing:mean 28 msgusts 38 msSWWNWPärnu level response:275 cm(in tideless sea)
Surge height depends on - background Baltic sea level before the event- cyclone trajectory (i.e. wind speed and direction). For Pärnu the most dangerous trajectories lie between the red arrows.
2D hindcast modelling of sea level and flows:24 km3 water entered the Gulf of Riga, strong flushing, coastal erosion, etc.
The areas of potential inundation in Pärnu City (45 000 residents) in case of 1.5, 2.5 and 3.5 m sea level rise.
Storminess in Estonia (at Vilsandi Island) data compiled by J.Jaagus, see also Suursaar et al., 2006b
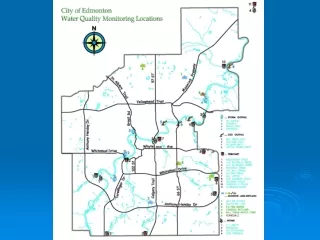
Sea level and surge statistics in Estonia Tide gauges: 3-4 mareographs + tide poles
Ristna trends (West-Estonian Archipelago): summer/ winter Uplift 2.8 mm/yr
List of further figures: • Seasonality in sea level (and NAO) trends • Seasonal structure of correlations: NAO/ Sea level/ Storminess • Seasonal structure of Pärnu max, mean and min sea levels • 11 year running averages and corrected linear trendlines • Results of 2D modelled sea levels, Gulf of Riga • Modelled influence of changes in westerlies • Change in flow regime (cumulated fluxes) due to enhanced • S, SW, E winds at Järve (Saaremaa Island): • annual bottom stress could increase 2-3 fold • Return periods based on Pärnu max sea level data 1923-2005
Pärnu hourly data histogram, n=369 071, ca 15%=50 000, nout =ca 19h