Download

1 / 28
310 likes | 326 Vues
CooperVision Biofinity Line 13 OEE Performance Standardisation. CooperVision products are sold in over 100 countries around the world. Manufacturing. Distribution. Manufacturing. Warrior Close, Southampton - UK. Distribution. Liege Belgium. Rochester – New York USA. Distribution.

E N D
CooperVisionBiofinity Line 13 OEE Performance Standardisation CooperVision products are sold in over 100 countries around the world.
Manufacturing Distribution Manufacturing Warrior Close, Southampton - UK Distribution Liege Belgium Rochester – New York USA Distribution Distribution & Commercial Henrietta – New York USA Tokyo Japan Manufacturing Juana Diaz Puerto Rico Manufacturing R&D / AMT Delta Park Southampton UK Hamble, Southampton - UK Pilot Facility, Southampton - UK R&D + HQ Pleasanton California Manufacturing Manufacturing Costa Rica In progress Madrid Spain
Business Unit based CI . • In 2013 the company decided to make CI BU based. • This was deemed necessary because of: • Geographic spread of the BUs • Difference stages in the Product Life Cycle My role is to lead and support Continuous Improvement activities in the Biofinity Business unit at Hamble
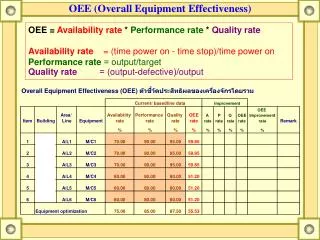
My Project - Background Information • In 2013 CooperVision introduced a new “Overall Equipment Effectiveness” (OEE) system into its Biofinity BU. • This was piloted on line 13 • After 6 months it became clear that there was a difference of up to 9.92% on overall performance between shifts • This difference was costing the company 1.9m in lost lenses at a monetary cost of $1m a year.
Process Flow – OEE work stations Fill and close feeds Peel. Peel is the bottleneck (or constraint) of the process. When Peel is running well F&C must be kept going to ensure Peel does not run out of work. AWL has at least 15% spare capacity, so is less critical for resources than the other two modules
Measurement system Using the various reports available from the OEE system enabled us to drill down in more detail to find the root causes. So finding hard data to support the variation was easy!
How to Measure the Soft data? Trying to find soft data to explain the variation was not so easy. I visited all shifts and shared the pre-projected data with them. This gave me the opportunity to discuss the data with the teams and try to understand the difference in performance. I noticed that there was a distinct difference in culture on the shifts. I wanted to explore this further to see if the difference in cultures had an effect on the shifts performance I formed a project team which included someone from each shift and job role.
Measure - Surveys, Observation and Meetings I conducted a series of Surveys with staff from all shifts. This included Team leaders Manufacturing support engineers Technical operators Operators Using a Radar diagram as a Cultural Web enabled me to ‘Measure’ the culture of each shift. We used this as a benchmark
Measuring the line performance September to December 2013 • Factors contributing to the difference between shifts were: • Planned services • Fill and Close - Unplanned downtime • Peel - Batch changes • Peel - Unplanned Downtime • AWL - yield loss
Analyse – Decision making Reasons for the differences included • Decision making • Organising staff • Escalation • Batch changes (SMED) • Yield loss (no lens)
Analyse - Yield loss Data Blue and Red shift Blue shift Yield loss, Sept to Jan is 16.01%. The highest category is ‘No Lens’. Red shift Yield loss data is 12.92%. The highest category is surface splits. The 3rd highest category is ‘No Lens’.
Analyse - Peel batch change times The data indicated that batch changes are take longer on one shift.
Analyse - Surveys Analysis of the surveys, observations and meetings with the shifts seemed to show: The higher performing shifts were strong on Leadership, Flexibility Customer & Results The lower performing shifts were Strong on Routines Low on Processes, Leadership and Flexibility They also Had very low morale Had poor relationships with the support services Had a poor relationship with their team leaders
Analyse – Root causes The root causes for the variation seemed to be differences in ‘Ways of Working’ This aligned with the Culture of the shifts!
Improve - The team were involved in the solution! The team brainstormed some improvement ideas and scored them on a Priority Based Matrix
OCAP – ‘No Lens’ Management • OCAP = Out-of-Control-Action-Plan • The first OCAP we trialled was for ‘No Lens’ management • The Out-of-Control situation triggers the OCAP. • The flow chart will tell the production staff what checks to make and when to escalate to MSE • OCAPs promote • Teamwork • Standardisation • Best Practice.
Best Practice – Tray population A Best Practice WI was created from a white Belt project for Tray Population. This works well with the first SPC and OCAP as it reduces ‘No Lens’ failures
Teambuilding Problem solving The teams were involved in their own problem solving
Teambuilding Workshops Presentation put together by Red/Blue shift after their Team building Event
Yield Loss July 2014 – Blue shift Improve - Outcomes Blue shifts Yield loss in July is 12.64%. (from 16.01%) No-Lens has reduced by 2.86% It is now 9th on their Pareto instead of 1st.
Peel Batch changes July 2014 There is no significant difference between shifts on Peel batch changes. Best Practices have been shared and followed.
Overall Shift Performance • By July 2014 the variation between shifts reduced to 1.62%. • This equates to a cost saving of $850k a year on line 13
No lens – Sept 2013 to July 2014. Statistical Process Control was introduced to the line at the end of May 2014. Using SPC in conjunction with the OCAP has shown a reduction in ‘No Lens’ and a more stable process All shifts have reduced from 2.35% to 0.54% Blue shift have reduced from 2.85% to 0.55%
Updating the Cultural Web As performance improved so did the scores on the cultural web. The teams have now started to challenge their own behaviours. They use the Cultural Web as a tool to measuring their Culture
Standardise and Control The company invested in a full Process Control system By 2015 this system was rolled out to all 13 Biofinity lines OCAPs continue to be created where appropriate. The system has also been introduced into other BUs The owners of the OEE system owners have asked to use CV as a case study to promote their product.
Continuing with the Cultural change Process control was a new tool in CV and brought about a high level Cultural Change. To manage this we: Held workshops with Shift leaders Gave presentations to Team leaders and MSEs Created a leaflet explaining culture for the manufacturing staff This work is still ongoing
Lessons learned The key lesson learned was that how ever good a new system is, it won’t work unless the culture of the people using it is taken into account. In other words E = Q X A Effectiveness = Quality X Acceptance
Thank You Any Questions?