Download
1 / 10
100 likes | 183 Vues
Water vapour soundings in the upper troposphere. Geraint Vaughan University of Wales, Aberystwyth. With thanks to: Clare Cambridge, Alan Phillips, Les Dean, Graham Hansford and Rod Jones. Comparison of three instruments. Vaisala RS80-A Humicap, with Miloshevic et al (2000) correction applied

E N D
Water vapour soundings in the upper troposphere Geraint Vaughan University of Wales, Aberystwyth With thanks to: Clare Cambridge, Alan Phillips, Les Dean, Graham Hansford and Rod Jones
Comparison of three instruments • Vaisala RS80-A Humicap, with Miloshevic et al (2000) correction applied • Meteorlabor Snow White Frost Point Hygrometer • University of Cambridge Surface Acoustic Wave FPH. 30 joint flights from Aberystwyth together with an ECC ozonesonde, using RS80 telemetry via TMAX-C interface card UTLS ozone funded project
Snow White, ECC and RS80 SNOW WHITE RS80 Air inlet Peltier cooler and chilled mirror ECC ozonesonde
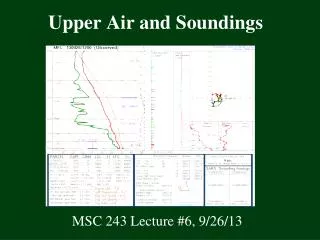
Example profiles 1 RH with respect to ice RH with respect to ice Snow White (black) RS80 (Red) SAW (Green) Photo-transistor (Turquoise) Snow White is very susceptible to contamination. Left: clean profile, right: contaminated profile (based on phototransistor). SAW is the only instrument capable of stratospheric measurements.
Example profiles 2 Snow White (black) RS80 (Red) SAW (Green) Photo-transistor (Turquoise) RH with respect to ice RH with respect to ice Good agreement; SW control circuitry unstable near tropopause SAW measurements into the stratosphere
Comparison between Snow White and RS80 in UT With respect to ice Conclusion: No evidence of systematic bias in radiosondes.
Scatter plots, coloured by ozone amount Conclusion: frequent occurrence of high (> 120 ppbv) ozone with RH > 25 % - indicative of mixing between stratospheric and tropospheric air
Extension to ozonesonde database Apply Miloshevic correction to RH measured on 324 ozonesonde profiles launched from Aberystwyth between 1991 and 2002
Conclusions • Reasonable agreement between the three techniques • RS80A profiles do not exhibit bias at high altitude if corrected according to Miloshevic et al (2000) • Frequent instances of RHice>100% at high altitudes • Frequent instances of high ozone mixing ratio and RH > 25% above 10 km