Download
1 / 14
140 likes | 345 Vues
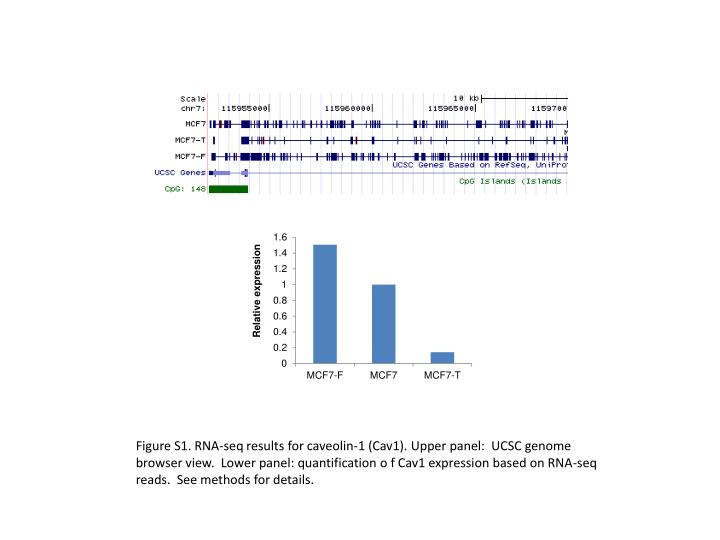
Figure S1. RNA-seq results for caveolin-1 (Cav1). Upper panel: UCSC genome browser view. Lower panel: quantification o f Cav1 expression based on RNA-seq reads. See methods for details. **.

E N D
Figure S1. RNA-seq results for caveolin-1 (Cav1). Upper panel: UCSC genome browser view. Lower panel: quantification o f Cav1 expression based on RNA-seq reads. See methods for details.
** Figure S2. Fulvestrant sensitivity of Cav1-overexpressing MCF7-T cell. Cells were transfected with pCMV6-XL5 (vector) or Cav1 overexpression plasmid (pCAV1) and then treated with the indicated doses of fulvestrant for 7 days. Cell viability was determined by MTT assay (absorbance at 600 nm linearly correlated with cell number; mean ± s.e., n=6; **P < 0.01).
a b Figure S3. Tamoxifen sensitivity of Cav1-overexpressing MCF7 (a) and MCF7-T (b) cell. Cells were transfected with pCMV6-XL5 (vector) or Cav1 overexpression plasmid (pCAV1) and then treated with the indicated doses of tamoxifen for 7 days. Cell viability was determined by MTT assay (absorbance at 600 nm linearly correlated with cell number; mean ± s.e., n=6; **P < 0.01).
** ** ** ** Figure S4. Migration/invasion activities of MCF7, MCF7-T and MCF7-F cells (mean ± s.e., n=3; **P < 0.01).
a b Figure S5. Clonogenicity of Cav1-overexpressing MCF7 (a) and MCF7-T (b) cell. Cells were transfected with pCMV6-XL5 (vector) or Cav1 overexpression plasmid (pCAV1) and cultured in growth medium for 2 weeks and colonies containing > 50 cells were scored (mean ± s.e., n=3). *P < 0.05.
a b * ** ** Figure S6. Migration/invasion activities of Cav1-overexpressing MCF7 (a) and MCF7-T (b) cell (mean ± s.e., n=3; **P < 0.01, *P < 0.05).
a b ** ** ** ** c ** ** ** ** Figure S7. a) Knockdown of Cav1 inhibits proliferation of MDA-MB-231 cells (mean ± s.e., n=3; **P < 0.01). Right corner: Downregulation of Cav1 protein by siRNAs, determined by western blot analysis. b) Clonogenic activity of MDA-MB-231 after transfected with siRNAs (mean ± s.e., n=6; **P < 0.01). c) Migration/invasion activities of MDA-MB-231 cells transfected with siRNAs (mean ± s.e., n=3; **P < 0.01).
5’CGI shore 3’CGI shore Figure S8. Methylation of CGI and CGI shores for Cav1. The two-headed arrows (blue) indicated the regions amplified for pyrosequencing analysis.
Figure S9. Pyrosequencing results of representative CpG sites at Cav1 CGI and CGI shores in breast cancer cell lines.
Figure S10. Pyrosequencing results for representative CpG sites in MCF7-T cells treated with the DNA methylation inhibitor 5 μM of 5-aza-CdR for 6 days .
** ** Figure S11. Pyrosequencing results for MCF7 and BT474 cells treated with 5 μM of 5-aza-dCR for 6 days. **P < 0.01.
Figure S12. Cav1 mRNA level in MCF7-F cells treated with 5 μM of 5-aza-dCR for 6 days. *P < 0.05.
Figure S13. UCSC genome browser view of ChIP-seq results of histone modifications near Cav1 CGI in MCF7 and MCF7-T cells. The histone modification ChIP-seq tag wiggle files were uploaded to the UCSC genome browser and visualized as custom tracks. The height of the stick represents the enrichment level. The Cav1 CpG island and gene structure are shown at the bottom.
Figure S14. Kaplan-Meier curve showing overall survival rate of all patients with tumor expression high or low level of Cav1 (total patient number=356, P value=0.32).