Download

1 / 14
140 likes | 240 Vues
Rapid Analysis of Mental Services (RAMS) An overview of correlates of high service utilisation in South-East Metropolitan Melbourne. A/Prof Fabrizio Carinci Director, Centre for Health Systems Research February 2003. Rapid Analysis of Mental Services (RAMS) A phase - Approch.

E N D
Rapid Analysis of Mental Services (RAMS)An overview of correlates of high service utilisation in South-East Metropolitan Melbourne A/Prof Fabrizio Carinci Director, Centre for Health Systems Research February 2003
Rapid Analysis of Mental Services (RAMS)A phase - Approch we’ve got new questions for Mental Health Services… 1. explore correlates of high demand and utilisation of health services both at the individual and organisational level 2. build user interfaces that would allow to simplify and automate the procedure of rapid analysis of mental services
Rapid Analysis of Mental Services (RAMS)SD phase - Scaling down operational data Database Team MIHSR Medical Informatics Leader (B.Cesnik) MIHSR Database manager (D.Anderson) SH Database manager (R.Thornton) Clinical Experts (S.Damodaran,A.Yontchev)
Rapid Analysis of Mental Services (RAMS)QT Phase (Question Time) Population Health Research Team Clinical Leader (P.Talman) Epidemiologist (E.Villanueva) Statistician (F.Carinci) Clinical Experts (S.Damodaran,A.Yontchev) • Main clinical question: • Identification of individual and structural characteristics associated to an increased rate of “events” in terms of the following outcome indicators: • abnormal length of stay • readmissions • excessive utilisation of mental services (“frequent flyers”) • Population: • Southern Health mental health catchment area • Time of observation: • 1/10/1999 - 30/9/2002
Rapid Analysis of Mental Services (RAMS)OD Phase - Outcomes Definition 1.HIGHLOS (TTLOS>45) Total 3-year LOS per subject > 45 days (75%) 2.HIGHCONT (N_CONT>100) More than 100 Contacts during the last 3-years (75%) 3.REVOLVE (N_ADM>3) “Revolving Door patient” No.Admissions >3 during the last 3 years 4.EARLREHOSP Rehospitalisation within 28 days 5.ADMLOS (TLOS>28) Single Admission Episode longer than 28 days 6.READM Readmission 7. NLS (LOS>28) “New Long Stay” Consecutive in-hospital presence > 28 days Analysis of the Literature Analyst/Statistician (F.Carinci) Epidemiologist (E.Villanueva)
Rapid Analysis of Mental Services (RAMS) ADM Phase - Analytical Data Management admission event contacts time separation
RAMS Outcomes Datasets (SHCN Mental Services, 1/10/1999-30/9/2002)
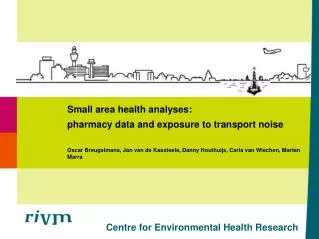
Mental Health Subjects (x 1.000 , N = 3118) - 0.1 - 2.4 2.5 - 5.6 6.0 - 7.9 9.4 - 12.8 12.9 RAMS catchment area (Melbourne Metro): individual subjects
Variable (Categories) _LASTRC_ HIGHLOS P(c2)* HIGHCONT P(c2)* REVOLVE P(c2)* N (%) 3243 (100.0) 891 (27.5) 819 (25.3) 347 (10.7) Age** 36 (5-103) 33 (12-92) 37 (9-91) 34 (15-87) Gender Males 1696 (52.2) 443 (26.1) 420 (24.8) 187 (11.1) Females 1547 (47.8) 448 (29.0) 399 (25.7) 159 (10.2) Country of Birth Australia 2446 (75.4) 643 (26.3) 596 (24.4) 265 (10.8) Europe-America 485 (15.0) 156 (32.2) .0120 134 (28.0) 52 (10.9) Middle East-Africa 104 (3.2) 30 (28.8) 31 (29.5) 11 (10.8) Asia 208 (6.4) 62 (29.8) 58 (27.4) 18 (8.6) ICD10 MDC F0: Organic 361 (11.1) 111 (38.0) <.0001 65 (19.8) .0155 32 (9.1) F1: Substance Abuse 880 (27.1) 137 (18.2) <.0001 170 (21.4) .0038 120 (14.3) <.0001 F2: Schizophrenia 1539 (47.5) 379 (27.6) 497 (34.0) <.0001 229 (15.1) <.0001 F3: Mood Disorder 1515 (46.7) 301 (22.1) <.0001 303 (21.0) <.0001 182 (12.2) .0089 F4: Neurotic 749 (23.1) 105 (15.9) <.0001 133 (19.4) <.0001 93 (12.8) .0339 F5: Behavioural 79 (2.4) 12 (19.7) 11 (15.1) .0430 9 (11.8) F6: Personality Disorder 654 (20.1) 102 (18.3) <.0001 124 (21.1) .0109 106 (17.2) <.0001 F7: Mental retardation 56 (1.7) 13 (30.2) <.0001 10 (20.0) 13 (25.4) .0005 F8: Psych. Development 31 (1.0) 5 (21.7) 2 (9.5) 5 (16.7) F9: Emotional 104 (3.2) 18 (23.1) 28 (31.8) 7 (6.8) Z72: Lifestyle/Addiction 346 (10.7) 71 (20.5) .0020 87 (23.9) 62 (15.1) .0021 Postcodes N>100 Dandenong [3175] 307 (9.5) 105 (34.1) .0060 91 (29.6) 44 (14.0) .0434 Noble Park [3174] 220 (6.8) 90 (41.1) <.0001 71 (32.1) .0149 39 (17.7) .0004 Clayton [3168] 122 (3.8) 34 (27.4) 41 (32.8) .0477 13 (10.6) Cranbourne [3977] 121 (3.7) 34 (25.9) 29 (22.1) 15 (11.8) Cheltenham [3192] 119 (3.7) 43 (36.1) .0310 28 (23.7) 4 (3.4) .0097 Springvale [3171] 107 (3.3) 25 (24.3) 27 (25.0) 10 (9.5) Bentleigh East [3165] 102 (3.1) 38 (38.4) .0130 32 (31.4) 21 (21.2) .0006 *UNIVARIATE TEST - category vs. complementary, ** median (range) Demographic and clinical characteristics
Socioeconomic and service related characteristics Variable (Categories) _LASTRC_ HIGHLOS P(c2)* HIGHCONT P(c2)* REVOLVE P(c2)* N (%) 3243 (100.0) 891 (27.5) 819 (25.3) 347 (10.7) Employed Yes 344 (10.6) 49 (14.2) <.0001 54 (15.6) <.0001 20 (5.8) .0020 No 2899 (89.4) 842 (29.0) 765 (26.4) 326 (11.2) Subordinate/Non Managerial Yes 2686 (82.8) 791 (29.4) <.0001 745 (27.8) <.0001 319 (11.9) <.0001 No 557 (17.2) 100 (17.9) 74 (13.1) 27 (4.8) Education: 7-10 years + Yes 2266 (69.9) 629 (27.8) 635 (28.1) <.0001 279 (12.3) <.0001 No 977 (30.1) 262 (26.8) 184 (18.8) 67 (6.8) Assisted by a carer Yes 368 (11.3) 161 (43.7) <.0001 130 (34.1) <.0001 59 (15.9) .0006 No 2875 (88.6) 730 (25.4) 689 (24.1) 287 (10.0) Admission Centre Clayton 1130 (34.5) 228 (25.6) .0320 399 (35.3) <.0001 110 (9.7) <.0001 Dandenong 1380 (42.6) 359 (26.0) <.0001 247 (18.3) <.0001 174 (12.6) .0026 Acute Child 267 (8.2) 95 (35.6) .0020 58 (22.7) 20 (7.4) Aged Care 466 (14.4) 209 (44.9) <.0001 115 (26.4) 42 (8.9) Average LOS 0-1 days 1071 (33.0) NA 274 (25.6) 23 (2.1) <.0001 1-3 days 1488 (45.9) NA 336 (22.6) .0013 182 (11.6) >3 days 684 (21.1) NA 209 (30.6) .0003 141 (18.0) Average Post Discharge Delay 0-3 days 1991 (61.4) 593 (29.8) .0002 494 (24.8) 119 (6.0) <.0001 4-6 days 334 (10.3) 91 (27.2) 139 (37.8) <.0001 71 (17.4) <.0001 1 wk or more 918 (28.3) 207 (22.5) <.0001 186 (17.2) <.0001 156 (14.1) <.0001 No.Contacts per Month 0-1 1946 (60.1) 399 (20.5) <.0001 NA 65 (3.3) <.0001 1-3 555 (17.1) 159 (28.7) NA 72 (11.8) >3 742 (22.9) 333 (44.9) <.0001 NA 209 (26.0) <.0001 *UNIVARIATE TEST - category vs. complementary, ** median (range)
Risk Model [HIGHLOS] Outcome:Cumulative .LOS>45 Cox Regression Results HR ; 95% CI Variable Age 0.99 ; 0.99-1.00 Male 0.93 ; 0.81-1.07 F1: Substance Abuse 0.74 ; 0.61-0.89 F2: Schizophrenia 0.63 ; 0.54-0.74 F3: Mood Disorder 0.78 ; 0.67-0.91 F4: Neurotic 0.55 ; 0.44-0.68 F9: Emotional 0.58 ; 0.35-0.97 Dandenong 1.39 ; 1.14-1.71 Acute Child 2.32 ; 1.71-3.15 Aged Care 1.79 ; 1.32-2.44 1-3 Contacts per month 1.48 ; 1.22-1.80 >3 Contacts per month 2.63 ; 2.23-3.11 Average post-discharge delay: 4-6 days 0.68 ; 0.54-0.86 Average post-discharge delay: 1 wk or more 0.69 ; 0.58-0.81 Employed 0.59 ; 0.44-0.79 Education: 7-10 years + 1.23 ; 1.05-1.44 Occupation: Subordinate/Non Managerial 1.62 ; 1.31-2.01 Z51-Z65 Social Problems 0.54 ; 0.36-0.81 Z72: Lifestyle/Addiction 1.53 ; 1.09-2.14 Other 0.64 ; 0.49-0.84 Dandenong [3175] 1.26 ; 1.01-1.57 Noble Park [3174] 1.54 ; 1.22-1.95 Bentleigh East [3165] 1.67 ; 1.19-2.33 Clayton South [3169] 1.60 ; 1.09-2.35 Cheltenham [3192] 1.53 ; 1.11-2.11 Doveton [3177] 1.94 ; 1.28-2.95 Hampton Park [3976] 1.60 ; 1.03-2.46 0.25 0.5 1.0 2.0 5.0 Decreased Risk Increased Risk HAZARD RATIO
Risk Model: [REVOLVE] Outcome:T.No.Adm.>=4 Cox Regression Results Variable HR ; 95% CI Age 0.98 ; 0.97-0.99 Male 1.02 ; 0.81-1.28 F3: Mood Disorder 1.33 ; 1.06-1.66 F4: Neurotic 1.40 ; 1.07-1.83 F6: Personality Disorder 1.97 ; 1.53-2.53 F7: Mental retardation 2.33 ; 1.31-4.14 F9: Emotional 0.39 ; 0.17-0.90 Average LOS: 1-3 days 2.92 ; 1.87-4.55 Average LOS>3 days 4.48 ; 2.82-7.12 Dandenong 1.40 ; 1.09-1.81 Acute Child 0.50 ; 0.28-0.88 1-3 Contacts per month 2.33 ; 1.66-3.28 >3 Contacts per month 6.27 ; 4.67-8.42 Average post-discharge delay: 1 wk or more 1.60 ; 1.28-2.00 Occupation: Subordinate/Non Managerial 1.70 ; 1.14-2.53 Assisted by a carer 1.49 ; 1.11-2.00 Continent of Birth: Asia 0.60 ; 0.37-0.97 Bentleigh East [3165] 1.96 ; 1.23-3.12 Cheltenham [3192] 0.35 ; 0.13-0.94 Doveton [3177] 1.92 ; 1.04-3.54 0.01 0.25 0.5 1.0 2.0 5.0 10.0 Decreased Risk Increased Risk HAZARD RATIO
Conclusions / Action lines • RAMS has produced a model to scale down CMI and perform rapid analysis for population health • Results of predictive modelling are relevant to the organisation of health services • The longitudinal structure of the model may be applied at the patient level • Validated concepts and statistical results may be incorporated into CMI to support integrated care • RAMS carries forward the SPHIS model, now capable of including contacts in the community Areas of improvement: • CMI lacks important information on known predictors of patient outcomes (medicines, compliance) that should be incorporated in the database to be relevant for fully integrated care • Overall health services utilisation is underestimated. Admissions for mental health patients not related to mental health services are not currently included. • A direct consequence is that comorbidity is underreported. CMI does include few non-MH diagnoses. • All the above factors may induce uncontrollable bias in all statistical analyses. For instance, the impact of chronic diseases, excessive use of medicines or non compliance is practically unknown. • Action plan: • Finalisation of the project report • Refinement and publication of the results in collaboration with the clinical experts • Publication and update of all SPHIS/RAMS material on dedicated website • Presentation of the model to users/DHS • Preparation of drafts for further development (data linkage with VAED/PBS, state-level analysis, national and international comparative studies)
Links Centre for Health Systems Research http://www.med.monash.edu.au/healthservices/chsr The RAMS project http://www.med.monash.edu.au/healthservices/chsr/projects/rams