Download
1 / 22
500 likes | 1.68k Vues
Tyson Foods. By: Sophia Toy. History. John Tyson Springdale, Arkansas Fortune 500 2 nd largest food production. Benchmarking/Trending. Tyson VS. Industry Averages Strong points Inventory Turnover Days Sales Outstanding (DSO) Profit Margin on Sales Weak points Return on Equity (ROE)

E N D
Tyson Foods By: Sophia Toy
History • John Tyson • Springdale, Arkansas • Fortune 500 • 2nd largest food production
Benchmarking/Trending • Tyson VS. Industry Averages • Strong points • Inventory Turnover • Days Sales Outstanding (DSO) • Profit Margin on Sales • Weak points • Return on Equity (ROE) • Return on Assets (ROA)
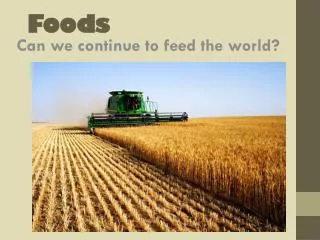
Capital Budgeting • Increase in chicken production • Expected employment growth • Exports • United Kingdom • Belgium • Spain • Hong Kong • Japan • South Africa • Yemen
Debt Ratio • 2008 • 46.0% < 59.30% Industry Average • 2007 • 46.5% < 59.30% Industry Average
Times-interest-earned (TIE) • 2008 • 1.53 <2.50 Industry Average • 2007 • 2.63 < 2.50 Industry Average
Interest Rate • Long-term Investment • Gain 1.09% • 2008: $2.89 Billion • 2007: $2.62 Billion • Average Borrowing Interest Rate • 2008: 7.0% • 2007: 7.4%
Return on Equity (ROE) • 2008 • 1.71% <5.80% Industry Average • Difference: 4.09% • RMA: 3.07% • 2007 • 5.66% <5.80% Industry Average • RMA: 8.67%
Weighted Average Cost of Capital (WACC) • 2007: • WACC: 6% • 2008: • WACC: 7% • Good indication for the company
Cash Flow from Operations &Interest Expense Coverage • Operating Income (Loss) • 2007: $613 million • 2008: $331 million • Interest Expense • 2007: $232 million • 2008: $215 million
Off-Balance Sheet Financing • Guarantees of debt of outside third parties: • Lease & Grower Loans • Residual Value (covers certain operating leases for various types of equipment)
Growth • Expansion • International Enterprise • Brazil • India • China • Exportation to over 90+ Countries • Chicken • Beef • Pork • Prepared foods • Sales Growth • Rose 4.4% • Retained Earnings • 2007: $2.9 Billion • 2008: $3.0 Billion
Dividends • Quarterly Dividends • Class A or Class B Stock • Low-regular-dividend-plus-extra Policy • Steady over the years • 2008 & 2007 • $56 Million • Dividends Per Share • 2008: $0.24/share • 2007: $0.75/share • Total Share Outstanding • 2008: $356 Million • 2007: $355 Million
Income Statement • Sales • 2007: $26 billion • 2008: $27 billion • Net Sales • 2007: $268 million • 2008: $86 million • Operating Loss • $26 million of charges • Plant closing • Impairments of unimproved real property • Software
Spontaneous Assets, Liabilities, & Equipment • 2008: Adopted FIN 48 • Accounting for Uncertainty in Income Taxes • No dramatic change • Slight increase in Total Assets, Total Liabilities, & Stockholders’ Equity • $10.23 million to $10.85 million
Plant Property & Equipment/Acquistions • Cash Spent on investing activities: • 2007: $285 million • 2008: $425 million • New equipment to upgrade facilities • Capital spending • Equipment updates • Chicken plants & Packaging equipments
Working Capital/Net Working Capital • Working Capital: • Current Assets used in operations • 2008: $4.36 billion • 2007: $3.68 billion • Net Working Capital: • Current Assets - Current Liabilities • 2008: $2.26 billion • 2007: $1.57 billion
Working Capital/Net Working Capital • Cash Conversion Cycle: • 2008: 35.36 days • 2007: 34.34 days • Industry Average:49 days • Overall, Tyson had a faster CCC than the industry average • Would not be able to operate with zero working capital • Financed a lot of financial activities with their working capital
Current Asset Policy • Tyson’s C/R 2.7x VS. Industry Average 2.0x • Relaxed Current Asset Policy
Management of Cash • Risks • Foreign exchange gain/loss exposure • Fluctuation in currency exchange rates • Impacts receivables & payable balance • Inventory Costs • 2007: $2.16 billion • 2008: $2.54 billion
Financial Transactions • Long-term Debt • 2008: $2.9 billion • 2007: $2.6 billion • Total Liabilities & Shareholders’ Equity • 2008: $10.9 billion • 2007: $10 billion