Download
1 / 60
740 likes | 1.19k Vues
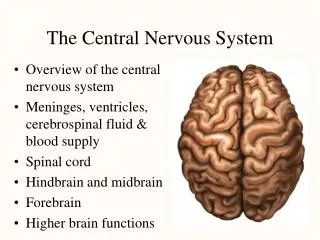
Virus Infections in the Central Nervous System. 2 main causes Herpes simplex: more encephalitis less meningitis Enterovirus: more meningitis less encephalitis sometimes the 2 combined Other causes: CMV, T. gondii, Mycoplasma pneumoniae some in relation to HIV or very rare.

E N D
Virus Infections in the Central Nervous System 2 main causes • Herpes simplex: more encephalitis less meningitis • Enterovirus: more meningitis less encephalitis sometimes the 2 combined Other causes: CMV, T. gondii, Mycoplasma pneumoniae some in relation to HIV or very rare
Viral Encephalitis: Incidence • Sweden: 2.3/106 people/yr Skoldenberg, Lancet 1984; ii:707 • Denmark: 1.8/106 people/yr Fonsgaard, CDU 1998; 9: 45 • Finland: 1.4/105 adults/yr: 16% due to HSV Rantalaiho, J. Neurol. Sci 2001; 184: 169 • Vienna: 1/105 adults/yr: incidence of herpes encephalitis Puchhammer-Stöckl, J Med Virol 2001: 64: 531-536 Most in children < 1 yr and adults > 65 yr, followed by 20-44 yr
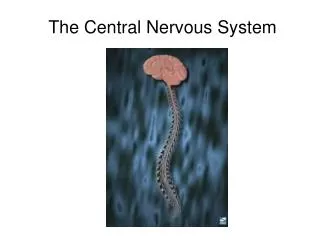
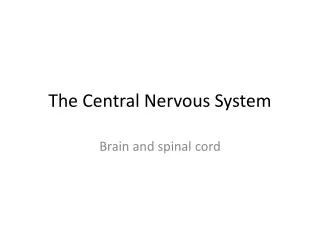
Herpes simplex virus • Structure of the virus • core, caspid, tegument and envelope
Herpes simplex Virus Infections in the Central Nervous System • Neonatal HSV • mostly HSV-2 by retrograde spread secondary to maternal genital infection • incidence: 1/3500 - 1/5000 births in US 1.65/100.000 births in UK* • HSV encephalitis • most commonly caused by HSV-1 • Recurrent aseptic meningitis (Mollaret’s meninigitis) • mainly associated with HSV-2 Tang YW et al. J Clin Microbiol 1999;27: 2127 Tookey et al. Pediatr Perinat Epid 1996; 10: 432
HSV Encephalitis • Leading cause of fatal encephalitis • 10 - 20 % of all viral encephalitis cases • Mortality up to 70 % • 2/3 of survivors neurological defectsl
Herpes simplex Encephalitis: Diagnosis Imaging Techniques • Focal inflammatory loci in the temporal lobes of the cerebral cortex • electro-encephalography (EEG) • computerized tomography (CTscan) • magnetic resonance imaging (MRI) helpful clinical direction but results lack sensitivity and specificity
HSV Encephalitis : Diagnosis • Diagnosis is difficult • in early stage : 10-20 % of encephalitis have normal cell counts • only 50 % elevated WBC • only 50 % elevated protein level • only 4 % with biopsy proven encephalitis : culture positive in CSF • serology is useless • CSF antibodies : elevated late in disease
Herpes simplex Encephalitis: Diagnosis Virus isolation • Isolation of HSV from brain tissue was considered as “gold standard” high efficiency of virus isolation ± 45% invasive procedure with serious complications including hemorrhage (2%) false negative results (4%) due to focal nature • Isolation of HSV from CSF low sensitivity positive in maximum 4% of brain biopsy proven cases Tang YW et al. J Clin Microbiol 1999; 37: 2127-36
Herpes simplex Encephalitis: Diagnosis Serology • by intrathecal antibodies: • of little clinical value since immune response in only few patients early; in most patients only after 2-3 weeks. • Standardization needed by concomitant detection of albumin to exclude passive diffusion of virus-specific antibodies into the CSF, thereby yielding false-positive results.
Molecular Diagnosis of HSV Encephalitis • 1st Molecular diagnosis: in situ hibridization with biotinylated cDNA probe in cell preparations after cytocentrifugation • 12 patients with HSE: 54 control cases 8/12: (67%) positive in methanol-fixed cells 3/12: (25%) in fresh acetone - fixed cells 11/12: (92%) POSITIVE sens. 92% 54/54: (controls) NEGATIVE spec. 100% Bamborschke S et al. J Neurol 1990; 237:73
PCR for Diagnosis of HSV Encephalitis • Brain biopsy ± CSF in patients suspected for HSE • PCR in CSF • 53/54 (98%): PCR positive in culture positive biopsies • 3/46 (6%): PCR positive in culture negative biopsies • all 18 CSF taken before brain biopsy: PCR positive • 4/19 CSF: PCR positive after 2 weeks of antiviral therapy PCR = “GOLD STANDARD” Lakeman F. J Infect Dis 1995; 172: 1641
Laboratory Techniques for Specific Diagnosis of HSV Infection in the CNS Test Ease of Turnaround Result interpretation performancea time Antigen detection 1 1-3 h May indicate infection if correlated with symptoms Cell culture 2-3 2-7 days Indicates active infection Serology 2 4-6 h Indirect; probably indicates active infection PCR 3-4 1-2 days Indicates active infection a Performance scores: 1, could be performed in most routine clinical laboratories; 2, could be performed in reference clinical laboratories; 3, could be performed in specialized research laboratories; 4, could be performed in laboratories with skilled technologists and space and equipment dedicated to performing molecular techniques. Tang YW et al. J Clin Microbiol 1999; 37: 2127-36
Laboratory Techniques for Specific Diagnosis of HSV Infection in the CNS Test Advantage(s) Disadvantage(s) Antigen detection Rapid Poor sensitivity and specificity Cell culture Isolate available for Very poor sensitivity; phenotypic timing of early antiviral specimen susceptibility collection critical testing Serology Potential for Results generally automation retrospective PCR High sensitivity and Facility requirement; specificity false positive due to carry- over contamination and false negative due to inhibitors in specimen Tang YW et al. J Clin Microbiol 1999; 37: 2127-36
PCR for HSV Encephalitis : Sample Transport and Processing • Transport to lab at 4°C in sterile vial • Stable for days up to weeks at 4°C • Multiple freeze-thawing to be avoided • Avoid contamination between samples (e.g. by aliquoting) Tang YW et al. J Clin Microbiol 1999; 37: 2127
CSF Preparation Prior to Nucleic Acid Amplification Principle Method (examples) CSF cell lysis Heating to 95°C, freezing thawing CSF cell lysis-protein Detergents (SDS), proteases (protease K), digestion chaotropioc agents (guanidiniun thiocyanate)a Nucleic acid concentration Ultracentrifugation Ethanol precipitation of nucleic acid Nucleic acid extraction Phenol-chloroform, spin column, silicate absorption, magnetic separation Cinque P et al. J Clin Virol 2003; 26: 1-28.
PCR Methods for HSV Encephalitis • Mono reaction with agarose gel electrophoresis or EIA detection • Multiplex reaction: • up to 6 viruses: HSV 1-2, VZV, CMV, EBV, HHV6 • PCR with consensus primers • Real time PCR Cinque P et al. J Clin Virol 2003; 26: 1-28.
Example of Multiplex PCR M HSV-1 (138 bp) HSV-2 (101 bp) VZV (266 bp) Cinque P et al. J Clin Virol 2003; 26: 1-28.
Example of PCR Assay with Consensus Primers Cinque P et al. J Clin Virol 2003; 26: 1-28.
Indications for molecular amplification techniques for the detection of Herpes Simplex Virus (HSV1-HSV2) 1. Patients with neurological symptoms: encephalitis, meningo-encephalitis, meningitis, myelitis 2. Patients with ophthalmological symptoms: keratitis, uveïtis, acute retinitis 3. Neonatal herpes infections 4. Imunocompromised patients with oesophageal and intestinal lesions
HSV Encephalitis : Diagnosis by PCR • More sensitive than culture • 53/54 biopsy proven : positive (Lakeman) • No commercial kits available • All methods are in house methods • HSV PCR = not standardized • PCR results may be different from different labs
Types of NATs in use in 2002 Types of NATs in use in 2003 Forde C. ECCMID 2004, P831
Molecular Diagnostic Tests : Proficiency Testing • To confirm skill of lab in test performance • To ensure reproducibility • To validate amplification methods • Frequency : • 2-3 testing events / year • 5 test samples / testing event covering full range : non reactive highly reactive • Samples : • whole organisms or isolated nucleic acids • previously characterized specimens • or duplicate, blinded specimens (internal consistency) NCCLS MM3-A. , 1995
Quality Control for Molecular Diagnostics Past, present trends……. Program *No Participants QCCA **No Part3cipants 2003 *QCCA % false Positive **2003 % false Positive QCCA % false Negative **2003 % false Negative *QCCA % Commercial Assays **2003 % commercial Assays CMV 79 95 2.4 1.9 21.0 18.0 28.0 16.3 CT 96 122 0.7 1.3 45.0 16.4 91.0 88.8 EBV N/A 84 N/A 2.3 N/A 17.7 N/A 22.7 <3% EV 59 101 4.0 6.7 31.0 18.9 5.0 11.2 HBV 42 79 5.3 1.1 18.0 9.7 56.0 48.3 30% HCV 55 92 1.3 0.0 11.0 7.1 76.0 74.6 ~18% HIV 50 90 2.3 0.0 15.0 15.7 89.0 86.1 9% HSV TB 71 103 4.8 5.6 16.0 15.7 6.0 11.2 N/A 74 N/A 7.0 N/A 22.9 N/A 65.9 Improved specificity Sensitivity Issues Rates variable Program dependant Source: *E Valentine-Thon JCV 25 (2002) S13-S21 ** Forde C, ECCMID 2004, P831
Quality Control for the Detection of HSV • Techniques for NA extraction, amplification and target sequences are heterogeneous • All labs use in-house developed methods • Application of real-time PCR increased from 7/12 (58%) labs in 2002 to 11/13 (85%) in 2004 • The use of inhibition control also increased from 7/12 (58%) labs in 2002 to 10/13 (77%) • Sensitivity and specificity of all methods used were excellent • No false positive results were reported in 2002; in 2004 6% of negative samples were reported false positive
Influence of Prevalence on Predictive Values for given test : Se = 99%, Sp = 98% Prevalence PPV NPV 1°/°°° 4.9 % 99.99 % 1 °/°° 4.7 % 99.99 % 1 % 33.3 % 99.98 % 2 % 50.0 % 99.98 % 3 % 60.0 % 99.97 % 4 % 67.0 % 99.96 % 5 % 72.0 % 99.95 % 10 % 84.0 % 99.89 % 20 % 92.0 % 99.75 % 30 % 95.0 % 99.56 % Goldberg M, 1990; “L’epidémiologie sans peine”
Algorithm for Specimen Processing and Reporting Results Specimen type / volume adequate Yes No specimen preparation Reject Control amplification - + dilute, reamplify Target amplification Control amplification - Product analysis + - Qiagen extraction Repeat testing - + - Report : “unable to process” Report as - Report as + Report as -
Utility of Amplification Methods for Virus Detection in CSF • HSV: PCR was shown to be the reference method Lakeman et al, J. Infect. Dis. 1995; 171:857 • Extended to herpes virus group • Extended to enterovirus detection in cases of meningitis Tanel et al., Arch. Pediatr. Adolesc. Med. 1996; 150: 919 Ahmed A et al, J. Pediatr. 1997; 131: 393 Van Vliet et al, J. Clin. Microbiol. 1998; 36: 2652 Enormous increase of requests for PCR on CSF
Molecular Diagnostic Methods in Meningo- encephalitis • Variety of possible etiologic agents • Stepwise approach, each step aimed at a combination of agents • Multiplex approach • Regional epidemiologic situation e.g. LCM, Coxiella burnetii, Borrelia burgdorferi : reference centers • Clinical condition : immunocompromised patient : Toxoplasma gondii, CMV
Molecular Diagnostics for Meningo-encephalitis pos HSV neg pos VZV M. pneumoniae Repeat to confirm neg pos pos CMV T. gondii Report result Report result neg
Detection of HSV DNA from CSF Specimens Collected at the Mayo Clinic from August 1993 through December 1997 Yr No. of No. of % No. of subjects positive HSV-positive specimens positive positive Male Female Unknown male/female tested specimens gender ratio 1993 80 3 3.8 1 1 1 1.0 1994 475 28 5.9 12 12 4 1.0 1995 1,019 90 8.8 37 48 5 0.77 1996 1,951 122 6.3 45 74 3 0.61 1997 3,082 166 5.4 63 99 4 0.64 Total 6,607 409 6.2 158 234 17 0.67 Tang YW et al. J Clin Microbiol 1999; 37: 2127-36
Effective Use of PCR for Diagnosis of CNS Infections No. (%) of tests with indicated result/no. of tests performed Both protein Protein level Leukocyte Both protein Organism level and normal, count normal, level and detected leukocyte leukocyte protein level leukocyte count count abnormal count normalabnormal abnormalTotal Herpesvirus* 0/209 (0) 1/33 (3.0) 5/317 (1.6) 18/173 (10.4) 24/732 (3.3) T. whippelii 0/56 (0) 0/3 (0) 1/101 (1.0) 0/30 (0) 1/190 (0.5) B. burgdorferi 0/149 (0) 0/18 (0) 0/215 (0) 0/89 (0) 0/471 (0) * Including HSV, EBV, VZV, and CMV Tang et al. Clin Infect Dis 1999; 29: 805-06
Restriction Rules for HSV Detection in CSF Reference N° cases / specimens Criterium Tang (1999) 24 / 723 WBC > 5 cells / mm3 and / or > 45 mg/dL protein workload reduction 29% Simko (2002) 10 / 406 WBC > 5 cells / mm3 and / or > 55 mg/dL protein workload reduction 38% increase of positivity rate: 1.9% 4% 2-fold Tang et al. Clin Infect Dis 1999; 29: 803 Simko et al. Clin Infect Dis 2002; 35: 414
Results of HSV DNA Detection in CSF by PCR and of HSV-specific Antibody Measurement in CSF and Sera in Patients with Clinical Suspicion of Encephalitis Method/detection Number of Positive Negative Interpretation patients results results PCR/HSV-1 DNA in CSF 631 8 (1.3%) 623 Direct confirmation of CNS infection by PCR PCR/HSV-2 DNA in CSF 631 7 (1.1%) 624 IFAT/intrathecal HSV IgM 624 13 (2.1%) 611 Serological evidence of CNS infection IFAT/intrathecal HSV IgG 624 12 (1.9%) 612 IFAT/HSV IgM, 4 fold 2367 268 (11.3%) 2099 Serological evidence of increase in IgG titres, active infection seroconversion Sauerbrei A et al. J Clin Virol 2000; 17: 31
Virological Diagnosis of Herpes simplex Encephalitis PCR versus serological diagnosis Study design: • 624 CSF samples: PCR + virus-specific antibodies • 2409 serum samples: virus-specific antibodies CONCLUSIONS: • No intrathecal antibodies in patients with positive PCR • Intrathecal immune response when CSF negative for PCR PCR: method of choice in early phase of disease Intrathecal antibodies: in later stage of disease Sauerbrei A et al. J Clin Virol 2000; 17: 31-36
Limits of Early Diagnosis of HSV Encephalitis in Children Prognosis depends on early and appropriate administration of specific antiviral therapy 38 children with proven HSV initial negative results: 8/33 CSF before day 3 associated with low level of protein < 10 WBC/mm3 De Tiege X et al. Clin Infect Dis 2003; 36: 1335
Quantitative PCR for Diagnosis of HSE • No correlation between quantity of virus genomes and severity of disease or prognosis Revello M. Clin Diagn Virol 1997; 7: 183 • Patients with >100 copies DNA/µl • older • brain lesions by CT scan • poorer outcomes than patients with <100 copies Dominguez R. J Clin Microbiol 1998; 36: 2229
Quantitative Real-Time PCR for the Detection of VZV in CSF Methods • Quantitative PCR on LightCycler with Real Art VZV LCkit • DNA isolation by High Pure Viral Nucleic Acid Kit Results • CSF viral load: • 10 x 102 copies/ml: meningitis • 5 x 10⁴ copies/ml: facial nerve paresis • viral load in vesicular fluid: 3x10⁶ copies/ml correlation between viral load and severity of disease remains uncertain ! Zampachova E et al. ECCMID 2004, P840
Example of NA Quantification in the CSF Virus Quantitative techniques Significance of NA quantitation in CSF HSV-1 Competitive PCR, Wide range of level variation (up to 107 copies/ml). real-time PCRAssociation of high DNA levels with bad HSE out- come? Decline of DNA levels following aciclovir therapy in HSE HSV-2 Real-time PCR Narrower range of level variation in patients with HSV-2 meningitis than in patients with HSV-1 encephalitis. Highest levels found in children with congenital infection (up to 106 copies/ml) VZV Semiquantitative PCR, Higher levels in patients with herpes zoster compli- real-time PCR cations than in those with varicella Cinque P et al. J Clin Virol 2003; 26: 1-28.
PCR Results following Completion of Antiviral Therapy PCR Infant characteristic Negativea PositivebP value Disease classification CNS 4 (36.4%) 14 (73.7%) <0.001 Disseminated 0 (0.0%) 5 (26.3 %) SEM 7 (63.6%) 0 (0.0%) Morbidity and mortality after 12 mo Normal 6 (54.5%) 1 (5.3%) <0.001 Mild 0 (0.0%) 0 (0.0%) Moderate 1 (9.1%) 3 (15.8%) Severe 2 (18.2%) 10 (52.6%) Dead 0 (0.0%) 5 (26.3%) a All samples were negative after treatment bone positive result Romero JR, Kimberlin DW. Clin Lab Med 2003; 23:843-865
Etiology of Viral Meningitis • Retrospective analysis of 43 causecutive cases of aseptic meningitis 43 cases : 19 (44%) enterovirus 1 (2%) HIV 2 (5%) VZV 5 (12%) HSV 1+2 1 (2%) CEE 15 (35%) unknown Acyclovir initially administered to all cases Hospitalization time : 16 - 31 days Nowak A et al. Eur J Neurol 2003; 10: 271-8.
Types and Characteristics of Human Enterovirus 66 serotypes known Group Virus types CPE in cell cultures Pathology in Monkey Human newborn Kidney cells mice Poliovirus 3 types: 1-3 + + - Coxsacke A 23 types/ A1-22, A24 - or ± - or ± + Coxsackie B 6 types : B1-B6 + + + Echovirus 31 types (1-9, 11-27, + ± - 29-33) Enteroviruses 4 types (68-71) + + -
Types and Characteristics of Human Enterovirus Group Virus types Major disease associations Poliovirus 3 types (poliovirus 1-3) Paralytic poliomyelitis; aseptic meningitis; febrile illness Coxsackie virus 23 types (A1-A22, A24) Aseptic meningitis; herpangina; febrile group A illness; conjunctivitus (A24); hand, foot and mouth disease Coxsackie virus 6 types (B1-B6) Aseptic meningitis; severe generalised group B neonatal disease; myopericarditis;: encephalitis; pleurodynia (Bornholm disease); fibrile illness Echovirus 31 types (types1-9, Aseptic meningitis, rash, febrile illness 11-27, 29-33) conjunctivitis; severe generalised neonatal disease Enterovirus 4 types (types 68-71) Polio-like illness (E71): aseptic meningitis (E71); hand, foot and mouth disease (E71); epidemic conjunctivitis (E70)
Enterovirus: Epidemiology Distribution of the 15 most commonly reported nonpolio enterovirus, serotypes, by rank - National Enterovirus Surveillance System, United States, 2000-2001 2000 (n=577) 2001 (n=1,285) 2000-2001 (n=1,862) Rank Serotype % Serotype % Serotype % 1 Coxsackie B5 34.4 echo 18 30.8 echo 18 22.0 2 echo 6 8.8 echo 13 29.3 echo 13 20.8 3 coxsackie A9 8.7 coxsackie B2 7.6 coxsackie B5 11.9 4 Coxsackie B4 8.3 echo 6 4.8 coxsackie B2 6.3 5 echo 11 6.9 echo 4 4.1 echo 6 6.1 6 echo 9 6.2 echo 11 3.4 echo 11 4.5 7 coxsackie B2 3.5 coxsackie B3 3.0 coxsackie A9 4.0 8 echo 25 2.6 coxsackie B1 2.7 echo 9 3.3 9 echo 18 2.3 echo 9 2.0 coxsackie B4 3.2 10 enterovirus 71 2.1 coxsackie A9 2.0 echo 4 3.1 11 echo 16 1.9 coxsackie B5 1.7 coxsackie B3 2.4 12 echo 30 1.9 echo 30 1.7 coxsackie B1 2.0 13 echo 13 1.7 coxsackie B4 0.9 echo 30 1.8 14 echo 21 1.6 echo 25 0.6 echo 25 1.2 15 parecho 1* 1.4 enterovirus 71 0.6 enterovirus 71 1.1 Total 92.2 95.3 93.5 * Formerly echo 22. For all other serotypes, percentages were 7.8% in 2000, 4.7% in 2001, and 6.5% during 2000-2001. MMWR 2002;51:1047-49 Belgie 2000: echo 30; echo 6, coxsackie B 5 (M.Van Ranst)
Enteroviral Meningitis • Incidence: 219/105 children < 1 yr of age 19/105 children 1-4 yrs of age Rantakallia Sc. J Inf Dis. 1986; 18: 286 • Responsible for - 85-95% of meningitis with known etiology in USA - 10-20% of encephalitis cases in USA : estimate of 30.000-75.000 cases annualy • Underreported especially in adults
Enteroviral meningitis in Adults: Underestimated • Retrospective analysis of 30 cases • Characteristics symptoms: inconstant • CSF showed pleocytosis in 29/30 cases but predominance of lymphocytes in only 44% of patients • Management of patient varied markedly • CT scan : 33% • acyclovir: 20% • antibiotics: 53% • Laboratory tests requested on admission: • PCR herpes simplex: 9/30 (30%): all negative after 4 days PCR for enterovirus : 9/30 : alle positive • PCR enterovirus: 21/30 (70%) : all positive Rapid PCR results may avoid considerable medical expenditure Evidence for syndromic approach Peigue-La feuille H et al. Pathologie Biologie 2002; 50: 516-24
Diagnosis of Enteroviral Meningitis by Virus Culture • Insensitive: especially for coxsackie A viruses • Serotyping necessary for identification and epidemiology • Turnaround time : 4-8 days • No cell type supports replication of all EV types • Even with use of several cell types: • 25%-35% negative specimens • coxsackie on none of cell lines (suckling mice)
Virus : CPE of Enterovirus in Cell Culture CPE after 4-8 days
Diagnosis of Enteroviral Meningitis by Culture Total number of isolates: 73 Number RD cells MRC5 Vero Hep2 33 + + o o 25 + o o o 5 o o + + 5 o o + o 4 o + o o 1 o o o + Verstrepen et al., 2002
Diagnosis of Enteroviral Meningitis by Culture Interpretation of results • CSF: very specific but low sensitivity • blood: very specific but low sensitivity • stool and pharynx : sensitive but low specificity • excretion of virus in pharynx : 1-2 weeks in faeces : 7-11 weeks Chang et al. J Microbiol Infect 2001; 34: 167-70.