Download
1 / 38
380 likes | 486 Vues
Mutual Amplification Between Upper and Lower-Level Cyclonic Potential Vorticity in the Deepening of a Extratropical Cyclone: A Case Study. Holly A. Anderson Synoptic-Dynamic Meteorology Dr. Cunningham December 6, 2007. Objectives.

E N D
Mutual Amplification Between Upper and Lower-Level Cyclonic Potential Vorticity in the Deepening of a Extratropical Cyclone: A Case Study Holly A. Anderson Synoptic-Dynamic Meteorology Dr. Cunningham December 6, 2007
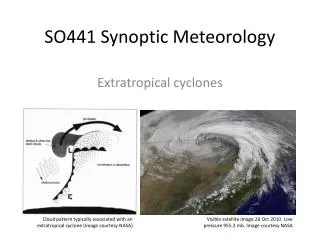
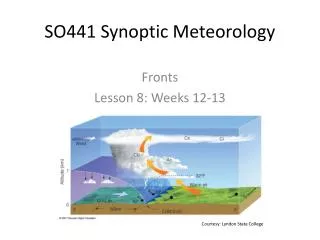
Objectives • An extratropical cyclone that formed on November 20, 2006 off the east coast of the United States is analyzed within a PV and isentropic framework. • This project seeks to describe the synoptic conditions leading to the development of the extratropical cyclone, as well as provide a study of the evolution of the associated potential vorticity fields as the upper-level cyclonic PV anomalies and the surface level cyclone mutually affect each other.
Case Study: November 21-22, 2006 • A developing coastal extratropical storm brought freezing temperatures, heavy rains, frozen precipitation, and erosion to the east coast. • Knocked down power lines and caused power outages to many along the east coast • Rainfall totals: • Georgetown, DE – 1.93” (49 mm) 22 Nov • Newark, NJ – 1.26” (32 mm) 23 Nov • Kennedy Airport, NY - 1.56” (40 mm) 23 Nov • Shoreham, NY – 2.83” (72 mm) 23 Nov • Bridgeport, CT – 1.84” (47 mm) 23 Nov • Hingham, MA – 4.76” (121 mm) 24 Nov
November 21, 2006 Snow flurries were reported by the National Weather Service as far south as central Florida in Orange, Lake, Seminole, and Volusia counties Florida as the state endured unusually early cold temperatures.
Charleston, South Carolina • The first record of thundersnow in local history. • Earliest winter season calendar date on which snow has been reported at KCHS. NWS PNS - http://www.erh.noaa.gov/chs/text/PNSCHS_11222006.txt
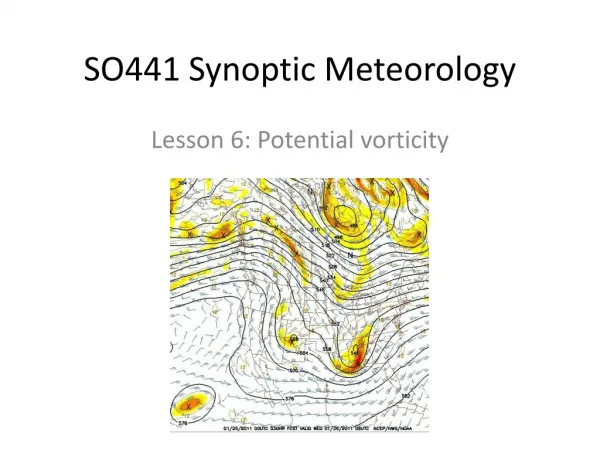
Isentropic Potential Vorticity: A Review • IPV is conserved following 3-D, adiabatic, inviscid flow along an isentrope. By plotting Ertel PV on an isentropic surface, we can see a conserved quantity along a surface of another conserved quantity. • Values of PV less than 2 PVU are typically tropospheric. Stratospheric values of PV are typically greater than 4 PVU, where 1 PVU = 10-6 m2s-1Kkg-1 (Bresky and Colucci, 1996). • For this study, the tropopause is defined by the 1.5 PVU surface. • PV values of 1.5-4 PVU define the “dynamic tropopause” (Bresky and Colucci, 1996).
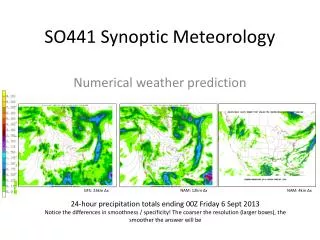
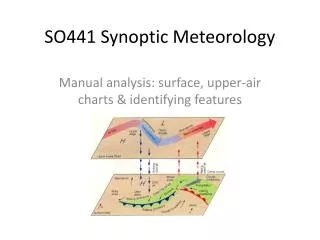
Data and Methodology • NCAR Computational and Information Systems Laboratory (CISL) Data for Atmospheric and Geosciences Research • NCEP Eta model data • 40 km resolution • 3 hour time intervals • 26 pressure levels • Analyzed in both Unidata Integrated Data Viewer (IDV) and GrADS • For this project, plan view plots of IPV at the 310K isentrope were plotted. • In addition, PV cross-sections were calculated using centered finite differencing at pressure levels from 1000-50 hPa. • By looking at plan views and vertical cross-sections, the interaction between the upper-level PV anomalies and the surface cyclone can be studied. The evolution in the position of the dynamic tropopause can also be noted.
PV and Cyclogenesis • Positive PV on the 310K surface indicate the positive PV field in the upper-troposphere. • The upper anomaly induces cyclonic motion that extends down into the troposphere. • The upper level cyclonic motion acts to amplify the cyclonic motion at the surface, strengthening the surface cyclone. • In turn, the surface cyclone amplifies the upper-level cyclonic motion. • As long as they tilt westward with height, cyclonic motions at upper and lower levels mutually amplify one another in a “feedback mechanism”. • Therefore, we expect to see higher PV values in the upper atmosphere as the surface cyclone deepens. • Tropopause depression is noted by upper-level PV anomalies.
21 November 00Z • Isobars indicate the cyclone is forming. • The upper PV field is to the west of the low-level cyclone.
21 November 12Z • The upper PV anomaly “blob” is tightening as the MSLP isobars tighten, indicating that both fields are strengthening and amplifying each other. The IPV at 310K has obtained a value of 5.5 PVU and is directly west of the surface cyclone.
21 November 12Z Location of the cross-section from 32N, 85W to 32N, 71W
21 November 12Z • As this cross-section cuts through the center of the cyclone, we see cyclonic motion from the meridional isotachs. • Isentropes also bend upwards into the positive PV anomaly. • Tropopause undulations are also seen. • Tropopausal values of PV are shown close to the surface.
22 November 00Z • The PV “blob” is advecting southeastward. The highest PVU value is 6 PVU, well into stratospheric values. The cyclone has achieved a low pressure of less than 1005 hPa.
22 November 00Z Location of the cross-section from 27N, 84W to 27N, 76W
22 November 00Z • Cyclonic motion is seen surrounding this PV anomaly. • The tropopause is low in the atmosphere, at approximately 500-550 hPa. This means stratospheric values are the lowest. This corresponds to what we expect as the cyclone intensifies.
22 November 12Z • The PV “blob” is at its tightest gradient, as is the surface low. The surface low pressure is less than 1002 hPa. • The highest PV values are southwest of the surface cyclone.
22 November 12Z Location of the cross-section from 31N, 81W to 31N, 78W
22 November 12Z • The 310K isentrope is clearly within stratospheric values and is found around the 400 hPa level. • The tropopause is higher at this time, at approximately 475 hPa. • The low-level PV anomaly is most likely due to diabatic heating at the surface.
23 November 00Z • By 00Z on the 23 November, the upper-PV “blob” is becoming less tilted westward with height. The IPV field at 310K has weakened considerably. PV values have lowered to more tropospheric values. Likewise, the cyclone has diminished in strength, as shown by higher pressure values and a smaller pressure gradient.
23 November 00Z Location of the cross-section from 81W, 31N to 77W, 31N through the southwestern part of the surface cyclone
23 November 00Z • Stratospheric values are back to the 225-250 hPa level. • The isentropes are also vertically stacked. • Cyclonic motion is visible from the isotachs of meridional wind. • PV of 1.5 PVU are at higher pressures, indicating the dynamic troposphere is very close to the ground.
23 November 12Z • The low continues to move off to the northeast, tracking alongside the east coast. PV values continue to diminish and the “blob” weakens as the PV anomaly is no longer tilted westward with height.
24 November 00Z • The PV “blob” decays to tropospheric values as the weakening cyclone moves northeastward off the coast. • At this point, the upper-level PV “blob” is beginning to tilt westward with height once again. As the cyclone moves off the coast, it will bomb and strengthen once again.
Concluding Remarks • Upper-level PV anomalies, noted by cyclonic motion, are amplified by lower-level cyclonic motion when they are tilted westward with height. • We can see a clear relationship between the strength of the surface cyclone and the PV values of upper-level anomalies. • Though this cyclone was not the strongest at this time, we can see how the upper-level PV anomalies and the surface low mutually amplified one another until they became stacked vertically with height and therefore decayed.
References • Jonathan E. Martin, 2006: Mid-Latitude Atmospheric Dynamics – A First Course, The University of Wisconsin-Madison. • Davis, C. A., and K. A. Emanuel, 1991: Potential vorticity diagnostics of cyclogenesis. Mon. Wea. Rev., 119, 1929-1953. • Bresky, Wayne C. and Stephen J. Colucci, 1996:A Forecast and Analyzed Cyclogenesis Event Diagnosed with Potential vorticity. Mon. Wea. Rev., 124, 2227–2244.