Download
1 / 57
600 likes | 802 Vues
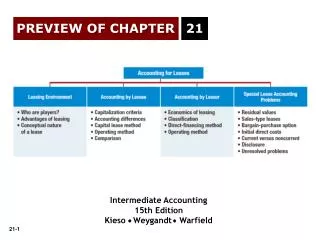
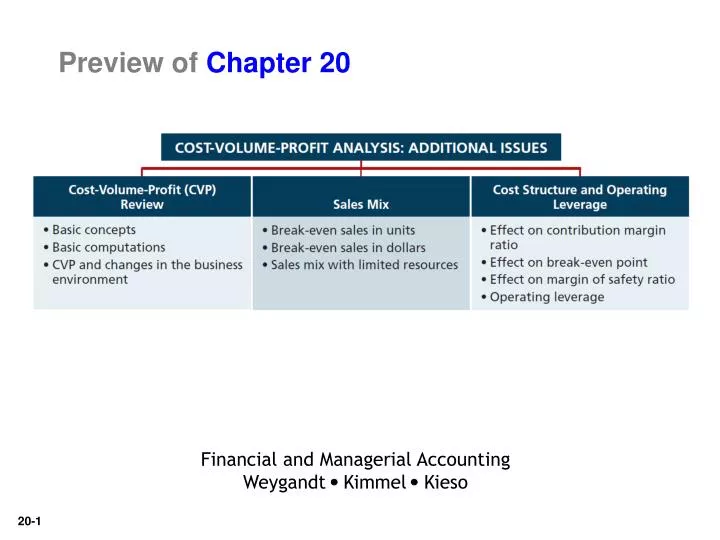
Preview of Chapter 20. Financial and Managerial Accounting Weygandt Kimmel Kieso. Cost-Volume-Profit (CVP) Review. CVP analysis is : The study of the effects of changes in costs and volume on a company’s profit. Important to profit planning. Critical in management decisions such as:

E N D
Preview ofChapter 20 Financial and Managerial Accounting Weygandt Kimmel Kieso
Cost-Volume-Profit (CVP) Review CVP analysis is: • The study of the effects of changes in costs and volume on a company’s profit. • Important to profit planning. • Critical in management decisions such as: • determining product mix, • maximizing use of production facilities, • setting selling prices.
Cost-Volume-Profit (CVP) Review • Management often wants the information reported in a special format income statement. • CVP income statement is for internal use only: • Costs and expenses classified as fixed or variable. • Reports contribution margin as a total amount and on a per unit basis. Basic Concepts
Cost-Volume-Profit (CVP) Review Basic Concepts Illustration 20-2 Detailed CVP income statement
Blue Diamond, Inc. sold 20,000 units and recorded sales of $800,000 for the first quarter of 2014. In making the sales, the company incurred the following costs and expenses. • Prepare a CVP income statement for the quarter ended March 31, 2014. • Compute the contribution margin per unit. • Compute the contribution margin ratio.
(b) Compute the contribution margin per unit. ÷ 20,000 = $40.00 ÷ 20,000 = $21.60 $18.40 Per unit
(c) Compute the contribution margin ratio. ÷ 800,000 = 46% or, $18.40 ÷ $40 = 46%
Cost-Volume-Profit (CVP) Review Basic Concepts Illustration 20-1 Basic CVP income statement
Cost-Volume-Profit (CVP) Review Basic Computations – Break-Even Analysis Illustration: Vargo Video’s CVP income statement (Ill. 6-2) shows that total fixed costs are $200,000, and the company’s contribution margin per unit is $200. Contribution margin can also be expressed in the form of the ratio which in the case of Vargo is 40% ($200 ÷ $500).
Cost-Volume-Profit (CVP) Review Basic Computations – Target Net Income Once a company achieves break-even sales, a sales goal can be set that will result in a target net income Illustration:Assuming Vargo’s fixed costs are $200,000 and target net income is $250,000, required sales in units and dollars to achieve this are:
Cost-Volume-Profit (CVP) Review Basic Computations – Margin of Safety Margin of safety • cells us how far sales can drop before the company will operate at a loss. • can be expressed in dollars or as a ratio. Illustration:Assume Vargo’s sales are $800,000:
Cost-Volume-Profit (CVP) Review CVP and Changes in the Business Environment Illustration: Original camcorder sales and cost data for Vargo Video: What is the contribution margin per unit ? __________ Sell Per Unit - Var Per Unit = CM Per Unit $500 – $300 = $200
Cost-Volume-Profit (CVP) Review CVP and Changes in the Business Environment Case I: A competitor is offering a 10% discount on the selling price of its camcorders. Management must decide whether to offer a similar discount. Question: What effect will a 10% discount on selling price ($500 x 10% = $50) have on the breakeven point?
Cost-Volume-Profit (CVP) Review CVP and Changes in the Business Environment Case II: Management invests in new robotic equipment that will lower the amount of direct labor required to make camcorders. Estimates are that total fixed costs will increase 30% and that variable cost per unit will decrease 30%. Question: What effect will the new equipment have on the sales volume required to break even?
Cost-Volume-Profit (CVP) Review CVP and Changes in the Business Environment • Case III: Your main supplier of raw materials is increasing prices. The higher cost will increase the variable cost of camcorders by $25 per unit. • Management decides NOT to raise selling price of the camcorders. • It plans cost-cutting that will save $17,500 in fixed costs per month. • Now earns monthly net income of $80,000 on sales of 1,400 camcorders. • Question: What increase in units sold will be needed to maintain the same level of net income?
Cost-Volume-Profit (CVP) Review CVP and Changes in the Business Environment Case III: Variable cost per unit increases to $325 ($300 + $25). Fixed costs are reduced to $182,500 ($200,000 - $17,500). Contribution margin per unit becomes $175 ($500 - $325).
Cost-Volume-Profit (CVP) Review Croc Catchers calculates its contribution margin to be less than zero. Which statement is true? Review Question a. Its fixed costs are less than the variable cost per unit. b. Its profits are greater than its total costs. c. The company should sell more units. • Its selling price is less than its variable costs.
Sales Mix Break-Even Sales in Units • Sales mix is the relative percentage in which a company sells its products. • If a company’s unit sales are 80% printers and 20% computers, its sales mix is 80% to 20%. • Sales mix is important because different products often have very different contribution margins.
Sales Mix Break-Even Sales in Units Companies can compute break-even sales for a mix of two or more products by determining the weighted-average unit contribution margin of all the products. Illustration: Vargo Video sells not only camcorders but TV sets as well. Vargo sells its two products in the following amounts: 1,500 camcorders and 500 TVs. Total Units Sold = ___?___. Sales mix, expressed as a function of total units sold, is:
Sales Mix Break-Even Sales in Units Additional information related to Vargo Video.
Sales Mix Break-Even Sales in Units First, determine the weighted-average contribution margin. $150 + $125 = $275 $200 X .75 = $150 $500 X .25 = $125
Sales Mix Break-Even Sales in Units Second, use the weighted-average unit contribution margin to compute the break-even point in units
Sales Mix Break-Even Sales in Units • With a break-even point of 1,000 units, Vargo must sell: • 750 Camcorders (1,000 units x 75%) • 250 TVs (1,000 units x 25%) • At this level, the total contribution margin will equal the fixed costs of $275,000.
Sales Mix Break-Even Sales in Dollars • Works well if the company has many products. • Calculates break-even point in terms of sales dollars for • divisions or • product lines, • NOT individual products.
Sales Mix Break-Even Sales in Dollars Illustration: Kale Garden Supply Company has two divisions.
Sales Mix Break-Even Sales in Dollars First, determine the weighted-average contribution margin. Second, calculate break-even point in dollars.
Sales Mix • With break-even sales of $937,500 and a sales mix of 20% to 80%, Kale must sell: • $187,500 from the Indoor Plant division • $750,000 from the Outdoor Plant division • If the sales mix becomes 50% to 50%, the weighted average contribution margin ratio changes to 35%, resulting in a lower break-even point of $857,143. Break-Even Sales in Dollars
Sales Mix Net income will be: Review Question a. Greater if more “higher-contribution margin” units are sold than “lower-contribution margin” units. b. Greater is more “lower-contribution margin” units are sold than “higher-contribution margin” units. c. Equal as song as total sales remain equal, regardless of which products are sold. d. Unaffected by changes in the mix of products sold.
Sales Mix Determining Sales Mix with Limited Resources • All companies have limited resources whether it be floor space, raw materials, direct labor hours, etc. • Management must decide which products to sell to maximize net income. Illustration:Vargo makes camcorders and TVs. Machine capacity is limited to 3,600 hours per month. Vargo’s “limited resource” is ___?___.
Sales Mix Determining Sales Mix with Limited Resources Calculate the contribution margin per unit of limited resource. Management should produce more camcorders if demand exists or else increase machine capacity.
Sales Mix Determining Sales Mix with Limited Resources If Vargo is able to increase machine capacity from 3,600 hours to 4,200 hours, the additional 600 hours could be used to produce either the camcorders or TVs. To maximize net income, all 600 hours should be used to produce and sell camcorders.
Sales Mix Theory of Constraints • Approach used to identify and manage constraints so as to achieve company goals. • Company must continually • identify its constraints and • find ways to reduce or eliminate them, where appropriate.
Sales Mix If the contribution margin per unit is $15 and it takes 3.0 machine hours to produce the unit, the contribution margin per unit of limited resource is: Review Question a. $25. b. $5. c. $4. d. No correct answer is given.
Cost Structure and Operating Leverage Cost Structure is the relative proportion of fixed versus variable costs that a company incurs. • May have a significant effect on profitability. • Company must carefully choose its cost structure.
Cost Structure and Operating Leverage Illustration: Vargo Video and one of its competitors, New Wave Company, both make camcorders. Vargo Video uses a traditional, labor-intensive manufacturing process. New Wave Company has invested in a completely automated system. The factory employees are involved only in setting up, adjusting, and maintaining the machinery. CVP income statements
Cost Structure and Operating Leverage Effect on Contribution Margin Ratio First let’s look at the contribution margin ratios.
Cost Structure and Operating Leverage • New Wave contributes 80 cents to net income for each dollar of increased sales while Vargo only contributes 40 cents. • New Wave’s cost structure which relies on fixed costs is more sensitive to changes in sales. Effect on Contribution Margin Ratio
Cost Structure and Operating Leverage • New Wave needs to generate $150,000 more in sales than Vargo to break-even. • Because of the greater break-even sales required, New Wave is a riskier company than Vargo. Effect on Break-Even Point Calculate the break-even point.
Cost Structure and Operating Leverage • The difference in ratios reflects the difference in risk between New Wave and Vargo. • Vargo can sustain a 38% decline in sales before operating at a loss versus only a 19% decline for New Wave. Effect on Margin of Safety Computation of margin of safety ratio
Cost Structure and Operating Leverage Operating Leverage • Extent that net income reacts to a given change in sales. • Higher fixed costs relative to variable costs cause a company to have higher operating leverage. • When sales revenues are increasing, high operating leverage means that profits will increase rapidly. • When sales revenues are declining, high operating leverage can have devastating consequences.
Cost Structure and Operating Leverage Degree of Operating Leverage • Provides a measure of a company’s earnings volatility. • Computed by dividing total contribution margin by net income. New Wave’s earnings would go up (or down) by about two times (5.33 ÷ 2.67 = 1.99) as much as Vargo’s with an equal increase in sales.
Cost Structure and Operating Leverage The degree of operating leverage: Review Question a. Can be computed by dividing total contribution margin by net income. b. Provides a measure of the company’s earnings volatility. c. Affects a company’s break-even point. d. All of the above.
APPENDIX 20A ABSORPTION VERSUS VARIABLE COSTING Under variable costing, product costs consist of: • Direct Materials • Direct Labor • Variable Manufacturing Overhead The difference between absorption and variable costing is:
APPENDIX 20A ABSORPTION VERSUS VARIABLE COSTING The difference between absorption and variable costing: • Under both costing methods, selling and administrative expenses are treated as period costs. • Companies may not use variable costing for external financial reports because GAAP requires that fixed manufacturing overhead be treated as a product cost.
APPENDIX 20A ABSORPTION VERSUS VARIABLE COSTING Illustration: Premium Corporation manufactures a polyurethane sealant, called Fix-It, for car windshields. Relevant data for Fix-It in January 2013, the first month of production, are as follows. Comparing Absorption with Variable Costing
APPENDIX 20A ABSORPTION VERSUS VARIABLE COSTING Per unit manufacturing cost under each approach. Comparing Absorption with Variable Costing The manufacturing cost per unit is $4 ($13 -$9) higher for absorption costing because fixed manufacturing costs are treated as product costs.
APPENDIX 20A ABSORPTION VERSUS VARIABLE COSTING Absorption Costing Example