Download
1 / 1
10 likes | 112 Vues
California Surface Temperature Trends. W. Kessomkiat 1 , E. Cordero 1 , and L. Bereket 2 1 Department of Meteorology, San Jos é State University, San Jos é , CA, USA; 2 Department of Mechanical Engineering, Santa Clara University, Santa Clara, CA, USA

E N D
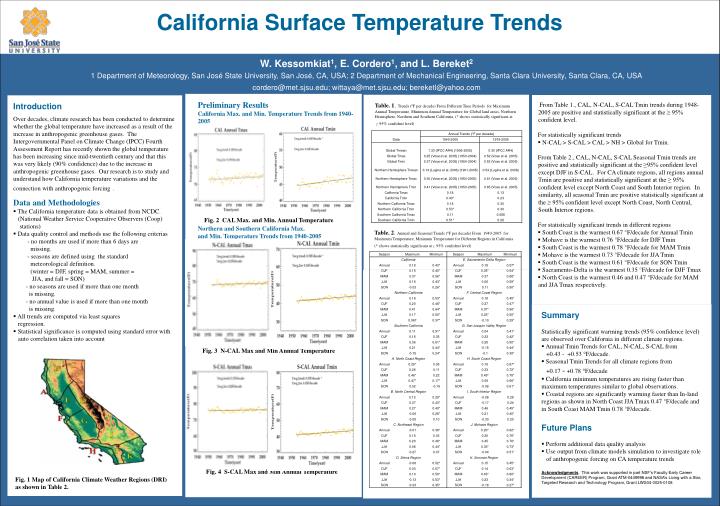
California Surface Temperature Trends W. Kessomkiat1, E. Cordero1, and L. Bereket2 1 Department of Meteorology, San José State University, San José, CA, USA; 2 Department of Mechanical Engineering, Santa Clara University, Santa Clara, CA, USA cordero@met.sjsu.edu; wittaya@met.sjsu.edu;bereketl@yahoo.com Preliminary Results California Max. and Min. Temperature Trends from 1940-2005 Northern and Southern California Max. and Min. Temperature Trends from 1940-2005 • From Table 1., CAL, N-CAL, S-CAL Tmin trends during 1948-2005 are positive and statistically significant at the ≥ 95% confident level. • For statistically significant trends • N-CAL > S-CAL > CAL > NH > Global for Tmin. From Table 2., CAL, N-CAL, S-CAL Seasonal Tmin trends are positive and statistically significant at the ≥95% confident level except DJF in S-CAL. For CA climate regions, all regions annual Tmin are positive and statistically significant at the ≥ 95% confident level except North Coast and South Interior region. In similarity, all seasonal Tmin are positive statistically significant at the ≥ 95% confident level except North Coast, North Central, South Interior regions. • For statistically significant trends in different regions • South Coast is the warmest 0.67 °F/decade for Annual Tmin • Mohave is the warmest 0.76 °F/decade for DJF Tmin • South Coast is the warmest 0.78 °F/decade for MAM Tmin • Mohave is the warmest 0.73 °F/decade for JJA Tmin • South Coast is the warmest 0.61 °F/decade for SON Tmin • Sacramento-Delta is the warmest 0.35 °F/decade for DJF Tmax • North Coast is the warmest 0.46 and 0.47 °F/decade for MAM and JJA Tmax respectively. • Introduction • Over decades, climate research has been conducted to determine whether the global temperature have increased as a result of the increase in anthropogenic greenhouse gases. The Intergovernmental Panel on Climate Change (IPCC) Fourth Assessment Report has recently shown the global temperature has been increasing since mid-twentieth century and that this was very likely (90% confidence) due to the increase in anthropogenic greenhouse gases. Our research is to study and understand how California temperature variations and the connection with anthropogenic forcing. • Data and Methodologies • The California temperature data is obtained from NCDC. (National Weather Service Cooperative Observers (Coop) stations) • Data quality control and methods use the following criterias • - no months are used if more than 6 days are • missing. • - seasons are defined using the standard • meteorological definition. • (winter = DJF, spring = MAM, summer = • JJA, and fall = SON) • - no seasons are used if more than one month • is missing. • - no annual value is used if more than one month • is missing. • All trends are computed via least squares • regression. • Statistical significance is computed using standard error with auto correlation taken into account Table. 1. Trends (ºF per decade) From Different Time Periods for Maximum Annual Temperature, Minimum Annual Temperature for Global land areas, Northern Hemisphere, Northern and Southern California, (* shows statistically significant at ≥95% confident level) Fig. 2 CAL Max. and Min. Annual Temperature Table. 2. Annual and Seasonal Trends (ºF per decade) From 1940-2005 for Maximum Temperature, Minimum Temperature for Different Regions in California (* shows statistically significant at ≥95% confident level) • Summary • Statistically significant warming trends (95% confidence level) are observed over California in different climate regions. • Annual Tmin Trends for CAL, N-CAL, S-CAL from +0.43 - +0.53 °F/decade. • Seasonal Tmin Trends for all climate regions from +0.17 - +0.78 °F/decade • California minimum temperatures are rising faster than maximum temperatures similar to global observations. • Coastal regions are significantly warming faster than In-land regions as shown in North Coast JJA Tmax 0.47 °F/decade and in South Coast MAM Tmin 0.78 °F/decade. • Future Plans • Perform additional data quality analysis • Use output from climate models simulation to investigate role of anthropogenic forcing on CA temperature trends • Acknowledgments. This work was supported in part NSF’s Faculty Early Career Development (CAREER) Program, Grant ATM-0449996 and NASA’s Living with a Star, Targeted Research and Technology Program, Grant LWS04-0025-0108 Fig. 3 N-CAL Max and Min Annual Temperature Fig. 4 S-CAL Max and Min Annual Temperature Fig. 1 Map of California Climate Weather Regions (DRI) as shown in Table 2.